Content
measurement of changes in the price level: consumer price index (CPI); possible difficulties in measurement
- The Consumer Price Index (CPI) is a measure of the average change over time in the prices paid by consumers for a fixed basket of goods and services.
- It is commonly used to track changes in the overall level of prices in an economy.
- Steps involved in constructing a Consumer Price Index (CPI)
- Choose a base year: The first step in constructing a CPI is to select a base year, which is typically a year with normal economic conditions (e.g. without war or natural disaster) that serves as a benchmark for all subsequent years.
- CPI for base year: 100
- Survey and sampling: A representative sample of retail outlets, including grocery stores, gas stations, and other retailers, is surveyed to collect price data on a "market basket" of goods and services that represent typical consumption patterns of consumers.
- The survey should cover a range of geographical locations and outlets to ensure that the CPI reflects the prices of the broad population.
- Determine weights: Each item in the market basket is assigned a weight that reflects its relative importance in the typical consumer's budget.
- The weights can be based on expenditure data from national household surveys or other sources.
- Find out price change for each category: The price change for each item in the market basket is then calculated by comparing the current price to the price in the base year.
- This calculation may require some adjustments for quality changes in goods over time.
- Multiply weights by price changes: The final step is to multiply the weights by the price changes to obtain the overall price change for the entire market basket.
- This produces a single numerical value that represents the percentage change in prices from the base year to the current year.
- This value is the CPI for that year.
- Choose a base year: The first step in constructing a CPI is to select a base year, which is typically a year with normal economic conditions (e.g. without war or natural disaster) that serves as a benchmark for all subsequent years.
- Example
- Choose a base year: 2012
- Survey and sampling: Collect price data for a market basket of goods and services at selected outlets in different regions.
- Determine weights: Assign weights to each item in the market basket based on a typical consumer's spending pattern.
Category Item Weight Housing Rent 35% Utilities 15% Food Groceries 20% Dining out 10% Transportation Gasoline 8% Public transport 7% Clothing Clothing 5% - Find out price change for each category: Compare current prices to the prices in the base year for each item in the market basket.
Category Item Base year price Current price Price change Housing Rent $1,200 $1,300 8.3% Utilities $150 $160 6.7% Food Groceries $400 $420 5.0% Dining out $200 $220 10.0% Assuming no price change for other categories (Transportation, Clothing)
- Multiply weights by price changes: Multiply the weights by the price changes and sum the results to obtain the CPI for the current year.
CPI = (0.35×0.083) + (0.15×0.067) + (0.2×0.05) + (0.1×0.1) + (0.08×0) + (0.07×0) + (0.05×0) = 0.042
This means that the CPI has increased by 4.2% since the base year of 2012.
- Possible difficulties or limitations in each step of constructing a Consumer Price Index (CPI)
- Choose a base year: One difficulty in choosing a base year is that the year selected may not be representative of typical economic conditions over the long term. This could lead to an overestimation or underestimation of inflation in subsequent years.
- Survey and sampling: One limitation of the survey and sampling process is that it can be expensive and time-consuming to collect data from a representative sample of retailers. There may also be concerns about the accuracy and completeness of the data collected, as well as the representativeness of the sample.
- Determine weights: The weights assigned to each item in the market basket are based on a typical consumer's spending pattern. However, spending patterns can change over time, and the CPI may not always reflect these changes. Also, the weights are calculated based on average expenditure data, which may not accurately reflect the spending patterns of all consumers.
- Find out price change for each category: One potential difficulty is that some items in the market basket may not be available in certain regions or outlets, making it difficult to obtain accurate price data. Additionally, quality changes in goods and services over time can make it difficult to compare prices accurately.
- Multiply weights by price changes: Multiplying the weights by the price changes assumes that consumers buy the same basket of goods and services in the same proportions over time. However, if consumers change their spending patterns, the CPI may not accurately reflect inflation.
distinction between money values (nominal) and real data
- The distinction between nominal and real data is that nominal values are expressed in current or actual prices, whereas real values are adjusted for inflation or changes in the general price level.
- Nominal (Money) values are expressed in current or actual prices.
- For example, if the price of a gallon of milk is $3.50 in 2023, then $3.50 is the nominal value of the price in 2023.
- Nominal values can be influenced by changes in prices due to inflation, supply and demand, or other factors.
- Real values are adjusted for inflation or changes in the general price level, so that they reflect the purchasing power of a given amount of money over time.
- Using real values can be important in making meaningful comparisons across time periods because it allows for a more accurate assessment of changes in economic variables over time. For example, if an individual's income increases by 5% from 2022 to 2023, but the general price level also increases by 2%, their real income has only increased by 3%. This helps to account for changes in the cost of living and provides a more accurate representation of economic growth or decline.
- Real values are calculated by dividing nominal values by a price index such as the Consumer Price Index (CPI), which measures changes in the price level over time. For example,
- Suppose the price of a gallon of milk in 2022 was $3.00 and the price increased to $3.50 in 2023. The nominal price increase between 2022 and 2023 is $0.50, or 16.7% ((3.50-3.00)/3.00×100%).
- To convert the nominal price to a real price, we need to adjust for changes in the general price level using the CPI. Let's assume the CPI in 2023 was 102 (i.e., 2% higher than in 2022).The real price in 2023 is calculated as follows:Real price = (Nominal price / CPI in 2023)×100
Real price increase = ($3.50 / 102)×100
Real price increase = $3.43 (rounded to the nearest cent) - Therefore, the real price of a gallon of milk in 2023 is $3.43, which takes into account the impact of inflation over that time period.
causes of inflation: cost-push and demand-pull inflation
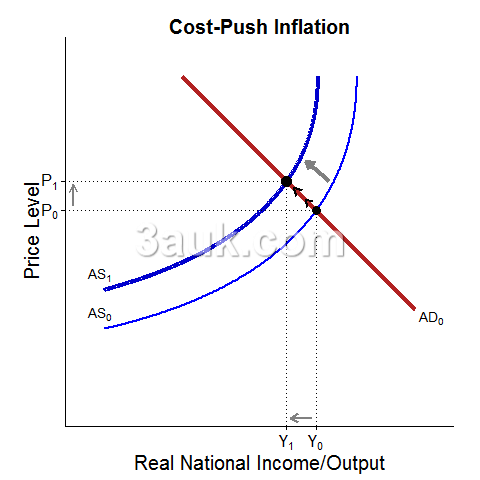
- Cost-push inflation: occurs when prices rise due to increased production costs, such as higher wages or raw material prices.
- This increase in production costs reduces the supply of goods and services, causing prices to rise.
- Businesses may then pass these higher costs on to consumers, leading to a general increase in prices across the economy.
- Cost-push inflation can also be caused by disruptions to supply chains, natural disasters, or geopolitical events that impact the production and distribution of goods and services.
- This increase in production costs reduces the supply of goods and services, causing prices to rise.
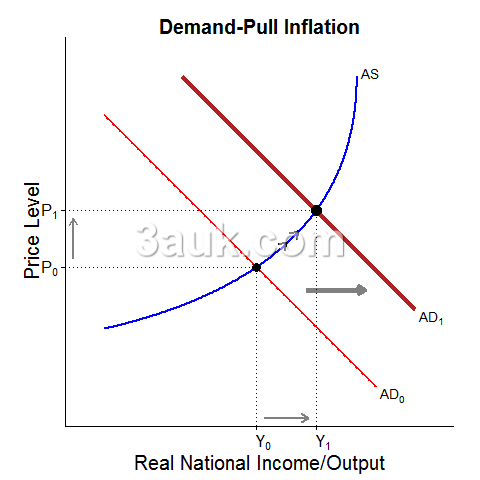
- Demand-pull inflation: occurs when prices rise due to an increase in aggregate demand for goods and services.
- As demand increases, producers may struggle to keep up with production, leading to a shortage of goods and services. This shortage can lead to higher prices as producers seek to balance supply and demand.
- Demand-pull inflation can also be caused by increases in government spending, changes in tax policies, or changes in monetary policy that increase the supply of money in the economy.
- These two types of inflation are not mutually exclusive and can interact with each other.
- For example, an increase in production costs could lead to cost-push inflation, which in turn could reduce the purchasing power of consumers, leading to a decrease in demand and further exacerbating inflationary pressures.
- Similarly, an increase in demand could lead to demand-pull inflation, which could drive up production costs as businesses try to increase supply to meet demand, leading to further increases in prices.
- Monetary inflation: Monetarists argue that the key cause of higher aggregate demand is the increase in the money supply. They suggest that inflation is caused by an increase in the supply of money that is faster than the output in an economy.
- When the amount of money in circulation increases, each unit of currency becomes less valuable, leading to a general increase in prices. This is because an increase in the supply of money leads to an increase in the demand for goods and services, which can push prices up.
consequences of inflation
- Reduced purchasing power: Inflation reduces the purchasing power of money, meaning that each unit of currency buys fewer goods and services than it used to. This can lead to reduced standards of living and reduced confidence in the economy.
- Decreased savings: Inflation can also lead to a decrease in the real value of savings, as the interest rate earned on savings may not keep up with the rate of inflation. This can discourage people from saving, which can make it difficult for individuals and businesses to invest in the future.
- Increased borrowing costs: Inflation can increase the cost of borrowing money, as lenders may demand higher interest rates to compensate for the risk of inflation. This can make it more difficult for individuals and businesses to borrow money and can discourage investment in the economy.
- Economic instability: High inflation can lead to economic instability, as prices and wages become unpredictable, making it difficult for businesses to plan for the future. This can lead to decreased economic growth, reduced investment, and even recession.
- Redistribution of wealth: Inflation can also lead to a redistribution of wealth, as those who hold assets that appreciate in value (such as property or stocks) may see their wealth increase, while those on fixed incomes or with savings may see their purchasing power decrease.
- Menu costs: the costs that businesses incur in changing their prices in response to inflation.
- For example, a restaurant may need to reprint its menus or a retailer may need to update its price tags, both of which incur costs.
- These costs can be significant, particularly for small businesses, and can reduce the profitability of these businesses.
- Shoe leather costs: the costs that individuals incur in response to inflation.
- When prices are rising, individuals may need to spend more time and money searching for the best prices, which can be thought of as "wearing out their shoe leather."
- This can include costs such as transportation costs to shop around, lost time spent searching for deals, and even increased risk of theft or fraud when dealing with unfamiliar sellers.
- Fiscal drag: the effect of inflation on taxation.
- As prices rise due to inflation, individuals and businesses may find that they are pushed into higher tax brackets, even if their real income has not increased.
- This can result in a higher tax burden on individuals and businesses, reducing their spending power and potentially slowing economic growth.
- Benefits of low and stable inflation
- Price stability: Low and stable inflation can help maintain price stability, which means that prices are less likely to experience sudden or sharp changes. This can lead to more predictable prices, which can benefit both consumers and businesses by providing greater certainty in planning and decision-making.
- Lower interest rates: Low and stable inflation can help keep interest rates low, which can encourage borrowing and investment. This can be particularly beneficial for businesses, which may be more likely to invest in new equipment, expand operations, or hire new workers when interest rates are low.
- Higher economic growth: Low and stable inflation can also be associated with higher economic growth, as it can reduce uncertainty and encourage investment. This can lead to more job creation, increased productivity, and overall economic expansion.
- Improved international competitiveness: Low and stable inflation can also improve a country's international competitiveness. When prices are stable, businesses can better predict their costs, making them more competitive in global markets. Additionally, low inflation can help keep exchange rates stable, which can make exports more affordable and attractive to foreign buyers.
- Reduced income inequality: Low and stable inflation can also reduce income inequality by providing more certainty in planning and decision-making. This can help lower-income individuals and households plan for the future, as they can more accurately predict the prices of goods and services they will need in the future.
- Factors affecting the consequences of inflation
- The cause of inflation: Different causes of inflation can have different consequences. For example, inflation that is driven by increases in production costs (cost-push inflation) can lead to lower output and higher unemployment, while inflation that is driven by increases in demand (demand-pull inflation) may lead to higher output and lower unemployment in the short term.
- The rate of inflation: The severity of the consequences of inflation can be influenced by the rate of inflation. Low inflation rates (around 2-3%) may have relatively minor consequences, while high inflation rates (above 10%) can have significant economic and social consequences, such as reduced purchasing power, increased uncertainty, and reduced investment.
- Whether inflation is accelerating or stable: Inflation that is accelerating (i.e. increasing at an increasing rate) can be particularly disruptive, as it makes it difficult for businesses and households to plan for the future. In contrast, stable inflation rates can provide greater certainty and may be easier to manage.
- Whether the inflation rate is expected or unexpected: If inflation is expected, businesses and households may be better able to adjust their behavior to mitigate the consequences. However, unexpected inflation can be particularly disruptive, as it can lead to uncertainty and reduce confidence in the economy.
- How the inflation rate compares with the rate of main competing countries: If a country's inflation rate is significantly higher than its main trading partners, this can lead to reduced competitiveness in international markets, as prices for goods and services produced in that country become relatively more expensive.
causes and consequences of deflation
- Causes of deflation
- Decreased aggregate demand: When demand for goods and services decreases, prices tend to fall as businesses reduce their prices to attract customers.
- Increased aggregate supply: If there is an increase in the supply of goods and services, this can cause prices to fall as businesses reduce their prices to compete with each other.
- Technological advances: Technological advances can increase productivity and reduce costs, which can lead to lower prices for goods and services.
- Consequences of deflation
- Positive consequences of deflation:
- Lower prices can increase the purchasing power of money, which means that consumers can buy more goods and services with the same amount of money.
- Lower prices can also benefit businesses, as they can reduce their costs and potentially increase profits.
- Increase international competitiveness of exports
- Negative consequences of deflation:
- Falling prices can lead to a decrease in economic activity, as businesses may reduce investment and employment, which can lead to lower consumer spending.
- Deflation can also lead to an increase in the real value of debt, as borrowers may have to pay back loans with money that has increased in value over time.
- Risk of deflationary spiral: A deflationary spiral can occur when falling prices lead to lower demand, which in turn causes prices to fall further. This can lead to a cycle of decreasing economic activity and falling prices, which can be difficult to reverse.
- Positive consequences of deflation:
Join the conversation