
Scarcity, Choice and Opportunity Cost
– Read the full analysis on Scarcity, Choice and Opportunity Cost.
Let’s be blunt: CAIE AS Level Economics is mostly about one unavoidable truth — you can’t have everything. Wants are endless, but resources — land, labour, capital, and attention — are limited. That mismatch is scarcity, and scarcity forces choice. Every time you choose, you implicitly accept an opportunity cost: the value of the next best option you gave up.
New to the CAIE AS syllabus? Our CAIE AS Level Economics 2025–2026: Beginner’s Essential Guide gives a concise walkthrough of the specification and how these foundational ideas are assessed — worth a quick read before diving into past-paper practice.
Concrete island example
Imagine a tiny island that makes only fish and surfboards. With fixed labour and raw materials, producing more surfboards lowers fish output. If all resources shift to surfboards, the opportunity cost is the fish not caught and the hungry tourists. Scarcity turns production decisions into both arithmetic and ethics.
Actionable practice
- When you make a choice, write down the single best alternative you sacrificed — practice spotting opportunity costs.
- Homework task: pick a recent government decision (for example, building a school) and list three likely opportunity costs.
- Use the three questions — what, how, for whom — to frame any news story about public spending or production.
- Want interactive questions to test this? Try our CAIE AS Economics – Topic Questions for quick MCQs and instant feedback.

How Economists Think: Models, Statements and Time
– Read the full analysis on Economic Methodology: positive versus normative, ceteris paribus, time horizons.
Economics uses models — simplified maps of complex behaviour — to clarify cause and effect. We do not have crystal balls. Instead, we rely on assumptions and the ceteris paribus rule (all else equal) to isolate relationships. That’s how tidy predictions become possible in a messy world.
If you want a friendly, exam-focused perspective that expands on model use and answer technique, see our broader A‑level starter: Econ, But Friendly: 2025–26 CAIE A‑level Economics (9708) Starter Guide. It’s useful once you start linking AS topics into A‑level themes.
Positive versus normative
A crucial exam distinction: positive statements are testable claims about how the world is (‘raising the minimum wage reduces employment for some workers’). Normative statements are value judgments (‘the government should raise the minimum wage’). CAIE examiners expect you to recognise whether a claim can be proven with data or is driven by values.
Time horizons matter
Short run: at least one factor is fixed (you can’t build a factory overnight). Long run: all factors can change (firms can build factories). Very long run: technology, institutions and tastes evolve. A policy may look sensible in the short run but behave differently in the long run — label your time horizon in answers.
Concrete classroom example
Ceteris paribus claim: if the price of coffee rises, demand will fall. That holds only if income, tastes and substitute prices stay the same. Throw in a taste shift (cold brew craze) or crop failure, and the tidy prediction can break.
Exam-ready takeaways
- Whenever you see a claim, identify whether it is positive (testable) or normative (value-based).
- Memorise ceteris paribus — it’s your tool for controlling messy causation in essays.
- Always state whether you mean short-run, long-run or very long-run when judging policy impact.

Factors of Production and Their Rewards
– Read the full analysis on Factors of Production.
The economy’s outputs are produced using four factors: land, labour, capital and enterprise. Each has a distinct role and return.
- Land: all natural resources (farmland, minerals, water). Return: rent.
- Labour: human effort — both physical and mental. Return: wages.
- Capital: man-made tools like machines, buildings and computers. Return: interest or capital returns.
- Enterprise: the entrepreneur who organises resources and takes risks. Return: profit.
Human capital versus physical capital
Human capital means skills, education and health. Physical capital means tools and machines. Investing in teachers, apprenticeships and health raises human capital and productivity; buying better machinery raises physical capital and output. Both matter for long-run growth.
Division of labour and specialisation
Breaking work into tasks speeds production — think of an assembly line. The trade-offs: worker boredom, potential deskilling, and vulnerability if one role disappears. Entrepreneurs knit these elements together: spotting opportunities, organising resources, and assuming risk. Successful entrepreneurs drive job creation and innovation; their failures are part of market dynamics.
Classroom example
A smartphone needs minerals (land), engineers (labour), assembly lines (capital) and a firm to combine them (enterprise). Training workers (human capital) and buying faster robots (physical capital) both raise productivity but in different ways.
Study tips
- Create one-line examples for each factor using local businesses (land = local park used for a farmers’ market). For ready-made examples and concise notes, see our CAIE AS Level Economics Study Notes.
- List three public policies that build human capital (education funding, healthcare access, apprenticeship subsidies).
- Debate pros and cons of specialisation in a workplace you know.

How Different Economies Allocate Resources
– Read the full analysis on Resource allocation in different economic systems.
CAIE AS Level Economics tests your understanding of allocation mechanisms. Think of three archetypes: market economies, planned (command) economies and mixed economies. Real-world systems are usually mixed, but the extremes help explain incentives and outcomes.
Market economies
Decision makers: households and firms. Prices coordinate choices.
Pros: efficient resource allocation via price signals, innovation incentives and responsiveness to consumer demand.
Cons: inequality, under-provision of public goods, and market failures such as pollution and monopolies.
Planned economies
Decision makers: central planners or the state.
Pros: ability to prioritise wide-scale mobilisations (rapid industrialisation or directed investment).
Cons: weak incentives, inefficient allocation, limited innovation and informational problems.
Mixed economies
Most countries blend market signals with government intervention. Governments provide public goods, regulate externalities, and redistribute income via taxation and welfare. The challenge is balancing efficiency (market strengths) and equity (government goals).
How allocation actually happens
- Market: allocation via prices, supply and demand.
- Planned: allocation via directives, quotas and state decisions.
- Mixed: markets operate, but governments step in where markets fail.
Practical example
Housing in a market: developers build where profits are highest, leaving low-income areas under-served. A planned system might allocate housing directly, risking inefficiency. A mixed approach uses social housing, subsidies and regulation to improve access.
Class exercise
Next time you read about a policy, identify whether proposed solutions are market-based (subsidies, price signals) or government-led (direct provision, regulation). Which would you prefer for tackling climate change and why?
Production Possibility Curves: Making Trade-offs Visual
– Read the full analysis on Production possibility curves.
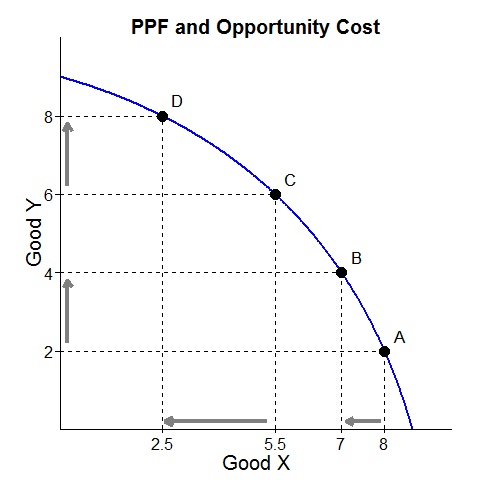
If economics had a doodle, the production possibility curve (PPC) would be it. A PPC shows the maximum combinations of two goods an economy can produce with existing resources and technology. It’s a visual reminder of scarcity, trade-offs and efficiency.
Reading the PPC
- Points on the curve: efficient use of resources.
- Points inside the curve: under-utilised resources (unemployment, idle factories).
- Points outside the curve: currently unattainable with existing resources.
Shapes and shifts
A straight-line PPC means constant opportunity cost; a bowed-out curve shows increasing opportunity cost — more of one good costs increasingly more of the other because resources are not equally suited to both. An outward shift means economic growth (more resources, better tech, improved human capital). An inward shift signals destruction of productive capacity (natural disaster, war, emigration).
Concrete example
Country A produces only guns and butter. In wartime, resources shift to guns, moving production point along the curve. A technological boost in butter production would bulge the PPC outward toward butter. A pandemic that reduces labour might push the whole curve inward.
Exam practice
- Draw three PPCs: constant opportunity cost (straight), increasing opportunity cost (bowed-out), and an outward shift showing economic growth.
- Use a simple numerical example to calculate opportunity cost — that’s a common exam task. If you want worked examples and printable practice, our CAIE AS Level Economics Study Notes include diagrams and step-by-step question guidance.

Classifying Goods: Public, Private, Merit and Demerit
– Read the full analysis on Classification of goods and services: Public, Private, Merit and Demerit.
Not all goods behave the same. Economists sort goods by rivalry and excludability — that tells us whether markets can provide them efficiently.
Private goods
Rival and excludable (for example, a sandwich). Markets generally provide these well.
Public goods
Non-rival and non-excludable (for example, street lighting or national defence). Markets under-provide due to the free-rider problem — government provision or funding is common (Cambridge Assessment International Education).
Free goods
Abundant and with no opportunity cost (air, in theory). In practice, previously free goods (like clean air) can become scarce.
Merit goods
Goods that provide wider social benefits and are under-consumed due to imperfect information (education, immunisation). Governments often subsidise or provide them directly.
Demerit goods
Goods harmful to consumers and society and often over-consumed (tobacco, excessive alcohol). Policies include taxation, regulation and bans.
Externalities and information failures
Externalities (pollution, noise) and asymmetric information (consumers unaware of risks) justify government intervention. Vaccinations are a classic merit-good case: individual protection creates social benefits via herd immunity.
Practical task
Classify five local goods into private, public, merit or demerit, and justify your choices. Consider which policy tools (taxes, subsidies, regulation, information campaigns) would change consumption.

Frequently Asked Questions (Exam-focused)
1. What is opportunity cost?
The value of the next best alternative given up when a choice is made.
2. Why use ceteris paribus?
To isolate the effect of one variable by holding others constant so cause and effect are clearer.
3. Can markets supply public goods?
Rarely in pure form because of non-excludability and free riders. Private provision can sometimes work via clubs or subscriptions, but usually government action is needed.
4. Human capital vs physical capital?
Human capital = skills, knowledge, health. Physical capital = machines, buildings. Both raise productivity but require different policies to accumulate.
5. Why is the PPC usually bowed outwards?
Because resources are specialised; shifting them causes increasing opportunity costs.
6. How to tell positive from normative statements?
If it’s testable with data, it’s positive. If it contains should/ought/value judgments, it’s normative.
7. Are mixed economies better?
‘Better’ depends on policy goals. Mixed economies aim to combine market efficiency with government correction of market failures.
8. What do entrepreneurs do in growth?
They innovate, organise resources and bear risk — often driving productivity improvements and new employment.
And yes, moderators: many of these themes will appear in exam questions.
Closing reminder
Economics is the art of making smart compromises. From CAIE AS Level basics like scarcity and opportunity cost to visual tools like the PPC and classifications of goods, the core skill is thinking clearly about trade-offs. Practice applying these ideas to local, national and hypothetical scenarios and you’ll not only survive the exam — you’ll actually understand how real-world decisions are made.
References & Further Reading
- Cambridge Assessment International Education — AS & A Level Economics syllabus: https://www.cambridgeinternational.org/programmes-and-qualifications/cambridge-international-as-and-a-level-economics-9708/
- CAIE AS Level Economics 2025–2026: Beginner’s Essential Guide: https://3auk.com/caie-as-level-economics-2025-2026-guide
- CAIE AS Level Economics Study Notes (free): https://3auk.com/courses/caie-alevel-economics-as/
- CAIE AS Economics – Topic Questions (MCQs & auto-grading): https://3auk.com/courses/caie-as-economics-topic-questions/
- Econ, But Friendly: 2025–26 CAIE A‑level Economics (9708) Starter Guide: https://3auk.com/essential-caie-a-level-economics-9708-student-guide-2025-2026/
- No-Sweat Guide to CAIE A‑Level Mathematics 9709 (2025–26) — useful if you want to strengthen quantitative skills: https://3auk.com/no-sweat-caie-a-level-maths-9709-2025-26
- United Nations World Water Development Report 2023 — “Water for a Sustainable World”: https://www.unwater.org/publications/un-world-water-development-report-2023
- World Bank — data and country economic indicators: https://data.worldbank.org
- International Monetary Fund (IMF) — global economic outlook and policy papers: https://www.imf.org
- Organisation for Economic Co-operation and Development (OECD): https://www.oecd.org
- Federal Reserve Education — resources on entrepreneurship and factors of production: https://www.federalreserveeducation.org
- International Labour Organization (ILO) — reports on labour markets and human capital: https://www.ilo.org
Final classroom practice: draw three PPCs (constant cost, increasing cost, outward shift), list opportunity costs for a local council budget decision, and classify ten goods in your area. Your revision will be sharper — and your exam answers will thank you.