
Why Understanding Cross Elasticity of Demand Matters in Everyday Shopping
Economics doesn’t have to be boring—especially when it comes to cross elasticity of demand (XED). Imagine you’re at the store, and the price of your favorite coffee skyrockets. Suddenly, tea looks like a steal. That’s XED at work, showing how the price of one product influences the demand for another. For A-Level students or anyone dipping their toes into microeconomics, grasping this concept unlocks the secrets of market interactions. It’s not just theory; it’s why your shopping cart changes based on sales and hikes. If you’re just starting out with CAIE A-Level Economics, check out our Econ, But Friendly: 2025–26 CAIE A‑level Economics (9708) Starter Guide for a solid foundation. Let’s break it down in a way that’s fun and straightforward, turning complex ideas into relatable insights.
– Check out our Price elasticity of demand GUIDE.
– Check out our Income elasticity of demand GUIDE.

Defining Cross Elasticity of Demand: The Basics
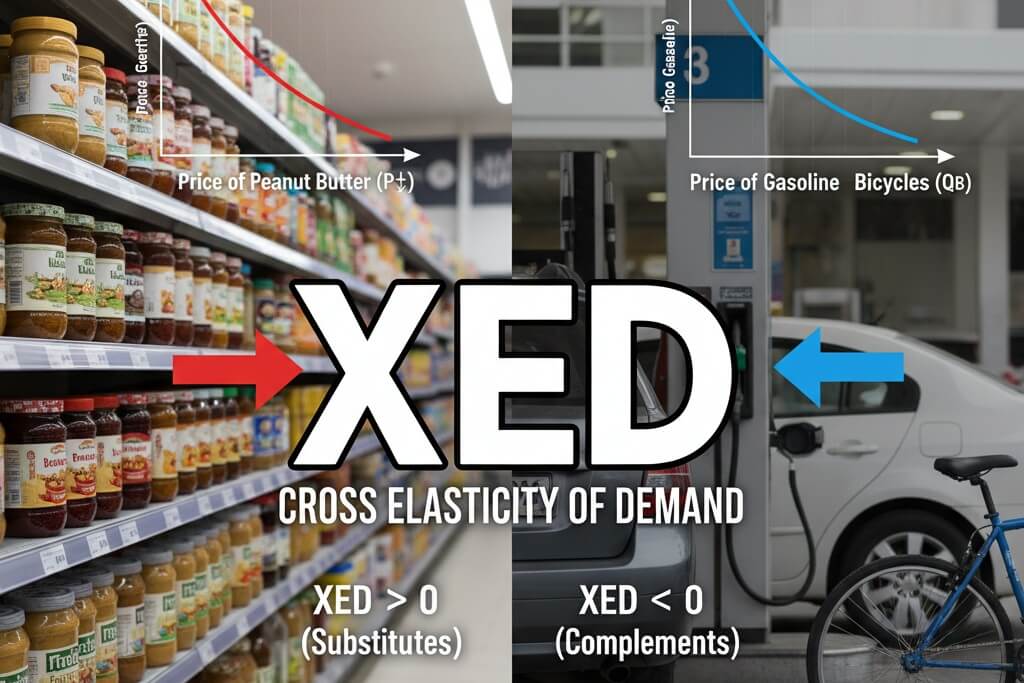
At its core, cross elasticity of demand measures how the quantity demanded of one good responds to a change in the price of another good. It’s essential for understanding relationships between products in the market. There are three main types: substitutes, where goods compete (like coffee and tea), complements, which go together (like smartphones and cases), and unrelated goods that barely affect each other (think books and toothpaste).
For substitutes, if the price of Good B rises, demand for Good A increases, resulting in a positive XED. Complements show a negative XED because a price increase in one reduces demand for both. Unrelated goods have an XED close to zero. This concept helps predict consumer behavior in real-world scenarios, such as during economic shifts or promotional pricing. To explore this within the broader price system, our CAIE AS Level Economics: The Price System and Microeconomy – Beginner’s Essential Guide dives deeper into how demand and elasticity shape markets.
Relatable Example: Consider the rivalry between streaming services. If Netflix raises its subscription price, viewers might switch to Hulu, indicating a positive cross elasticity of demand between them.
Key Takeaways:
- Identify substitutes by noticing what you choose when prices change.
- Positive XED signals competition; negative indicates dependency; zero means independence.
This foundation sets the stage for deeper analysis in your studies.

The Cross Elasticity of Demand Formula: Step-by-Step Guide
Formulas can seem intimidating, but the XED formula simplifies market analysis. It uses percentage changes to ensure accuracy across different price levels:
XED = \frac{\text{change in quantity demanded of Good A}}{\text{change in price of Good B}} = \frac{\frac{Q_{A2} – Q_{A1}}{Q_{A1}} \times 100}{\frac{P_{B2} – P_{B1}}{P_{B1}} \times 100}
Here, QA represents quantity demanded for Good A, and PB is the price of Good B. For initial calculations, use starting values; for larger changes, the midpoint method provides better precision.
Let’s walk through an example: Suppose the price of coffee increases from $4 to $5 (a 25% rise), and tea demand jumps from 80 to 100 units (also 25%). XED = 25% / 25% = +1, showing strong substitutability.
Practical Tip: Use tools like Excel to practice. Input your own scenarios, such as snack prices, to see how cross elasticity of demand plays out. For hands-on practice, try the CAIE AS Economics – Topic Questions to test your calculation skills.
Actionable Steps:
- Gather data on two related products.
- Calculate percentages and divide to find XED.
- Interpret results to understand market dynamics.
Mastering this makes you ready to tackle exam questions with confidence.

Interpreting XED Coefficients: Signs and Magnitudes
The value of the cross elasticity of demand coefficient reveals key insights. The sign indicates the relationship type, while the magnitude shows responsiveness.
- Positive XED (>0): Suggests substitutes. A higher value means greater sensitivity, like +2 for closely competing sodas.
- Negative XED (<0): Indicates complements. The absolute value measures how tightly linked they are, such as -1.5 for printers and ink.
- Zero XED (≈0): No significant relationship, common for unrelated items.
Magnitude matters: Elastic (|>1|) means big demand shifts; inelastic (|<1|) shows smaller reactions; unit (=1) is balanced. Percentages ensure fair comparisons, avoiding distortion from absolute numbers. If you're building on price-based elasticities, our Understanding Price Elasticity of Demand: A Beginner’s Guide for A-Level Students provides complementary insights into how own-price changes interact with cross effects.
Example in Action: During a 2023 fuel price surge, demand for public transport rose by 15% (XED +1.2 with gasoline), highlighting transport alternatives.
Takeaways:
- Start with the sign to classify goods.
- Use magnitude to assess competitive intensity.
This interpretation turns numbers into strategic knowledge.

Factors Influencing Cross Elasticity of Demand
Cross elasticity of demand varies based on several factors, making it dynamic rather than fixed. Key influencers include the availability of close substitutes or complements, consumer preferences, time horizon, and market demographics.
If many substitutes exist, positive XED increases—think smartphones where Android options abound for iPhone price hikes. For complements, scarcity deepens negative XED, like rare game titles with consoles.
Consumer habits play a role: Loyal brands lower XED for alternatives, but trends can amplify it, such as the shift toward plant-based foods boosting XED between meat and vegan options to +1.8 in recent years.
Time is crucial—short-term XED is often inelastic due to habits, but long-term allows adaptation, like growing electric vehicle demand post-fuel crises (XED +1.5).
Demographics matter too: Younger consumers might show higher XED for social media platforms compared to older groups.
Real-World Insight: The 2020 supply chain disruptions saw toilet paper XED spike positively as shoppers turned to alternatives amid shortages.
Tips for Analysis:
- Evaluate substitute closeness for your daily purchases.
- Consider how trends and time alter responses.
Understanding these factors enhances your predictive power in economics.

Applications of Cross Elasticity of Demand in Business and Policy
In practice, cross elasticity of demand guides critical decisions. Businesses use it for pricing strategies, product bundling, and market entry.
For competitive pricing, high positive XED warns of retaliation—airlines monitor rivals closely, adjusting fares to avoid demand losses. Differentiation, like unique branding, mitigates this.
Negative XED inspires bundling: A price cut on gaming consoles boosts game sales, as seen in 2023 with increased accessory revenue.
Policymakers apply XED for regulations, such as assessing monopolies in tech where low XED signals market power.
Case Example: Energy firms in 2023 redirected investments to renewables due to +1.5 XED with fossil fuels, capitalizing on shifting demand.
Practical Advice:
- For businesses: Simulate XED using sales data before changes.
- For consumers: Factor it into budgeting for related goods.
This tool transforms intuition into informed action.

Real-World Examples of Cross Elasticity of Demand
Seeing cross elasticity of demand in action makes it memorable. Here are recent cases:
Substitutes: In the UK 2023 dairy shortage, butter prices rose 15%, driving margarine demand up 18% (XED +1.2), benefiting plant-based brands amid health trends.
Complements: A 10% iPhone price drop led to an 8% increase in case sales (XED -0.8), reinforcing Apple’s ecosystem sales.
Policy Impact: Post-pandemic, ride-sharing price hikes of 12% boosted bus usage by 22% (XED +1.83), prompting fare subsidies in cities like NYC.
Streaming Wars: Netflix’s 10% increase shifted 9% of viewers to Disney+ (XED +0.9), fueling content competition.
These examples, drawn from market reports, illustrate XED’s role in daily economics.
Engagement Tip: Track a product pair like electric cars and gasoline weekly to compute your own XED.

Frequently Asked Questions About Cross Elasticity of Demand
- What does a zero XED mean? It indicates unrelated goods, like fruit and electronics—no price impact.
- How does XED differ from income elasticity? XED focuses on cross-product prices; income elasticity examines income effects. For more on this distinction, see our guide on Why Your Paycheck Raise Could Transform the Economy: Decoding Income Elasticity of Demand (YED).
- Can substitutes have negative XED? No, substitutes always show positive; negative is for complements.
- Why use percentages in XED? They provide scale-independent measures, ensuring fair analysis.
- When to use the midpoint formula? For significant changes to avoid bias; initial method suits small adjustments.
- How does time affect XED? Short-term is inelastic; long-term becomes more elastic with adaptation.
- Quick complement example? Gasoline price up 25% reduces car demand by 18% (XED -0.72).
- How do firms calculate XED? Through sales data, consumer surveys, and analytical software.
Conclusion: Mastering Cross Elasticity of Demand for Smarter Choices
Cross elasticity of demand reveals how interconnected markets are, from substitutes sparking competition to complements driving bundled sales. By calculating and interpreting XED, you can anticipate shifts in consumer behavior and business strategies. Dive into detailed notes with our CAIE AS Level Economics Study Notes to reinforce these concepts.
Final Takeaways:
- Focus on formula basics and interpretations.
- Apply to personal shopping and real scenarios.
- Explore resources for hands-on practice.
Next time prices fluctuate, you’ll see XED’s influence clearly—empowering your economic decisions.
Related articles:
– Check out our Price elasticity of demand GUIDE.
– Check out our Income elasticity of demand GUIDE.
References