The Sneaky Economics Behind Your Impulse Buys

Let’s face it—economics can sometimes feel as confusing as trying to keep up with a fast-paced action movie without any context. But hang in there, because price elasticity of demand (PED) is the key concept that reveals why a small increase in the price of your daily coffee doesn’t stop you from buying it, while a similar rise in concert ticket prices has you hunting for alternatives. In an era where prices are influenced by inflation, like the 2.2% rise in the UK in July 2024, PED helps explain why certain products continue to sell steadily and others see sharp drops in demand. By the time you finish reading, you’ll have the tools to explain to your friends why companies can’t just raise prices without considering the consequences. Here’s the exciting part: This isn’t dry theory; it’s essentially the psychology of consumer behavior backed by some straightforward calculations. If you’re just starting out with CAIE A-Level Economics, our Econ, But Friendly: 2025–26 CAIE A‑level Economics (9708) Starter Guide can provide a solid foundation to build on as you explore concepts like PED.
– Check out our Income elasticity of demand GUIDE.
– Check out our Cross elasticity of demand GUIDE.
– Check out our Price elasticity of supply GUIDE.
What Is Price Elasticity of Demand?

Imagine you’re at the movies, and the price of popcorn suddenly jumps, prompting you to opt for a cheaper snack like crisps instead. This scenario perfectly illustrates price elasticity of demand, which measures how sensitive the quantity demanded of a product is to changes in its price. In economic terms, PED quantifies the responsiveness of demand to price fluctuations, typically resulting in a negative value due to the inverse relationship between price and quantity demanded, as outlined by the law of demand. For simplicity, economists often use the absolute value, ignoring the negative sign to focus on the magnitude of responsiveness.
For those new to A-level economics, consider PED as a gauge of how much your purchasing decisions are affected by price shifts. It focuses on percentage changes rather than absolute amounts, allowing fair comparisons between price adjustments on everyday items like a banana versus high-value goods like smartphones. Understanding PED is crucial because it influences everything from your weekly shopping habits to why governments can impose taxes on items like cigarettes without drastically reducing consumption. Take the 2024 UK inflation period, for instance: Demand for essential foods like bread remained relatively stable, showing inelastic characteristics, while demand for luxury brunches declined noticeably. Personally, I’ve calculated my own PED for coffee and discovered it’s highly inelastic—meaning I’m hooked! Grasping this concept strengthens your foundation in microeconomics, demonstrating that markets follow predictable patterns rather than random chaos. To connect PED to broader microeconomic principles like demand and supply, explore our CAIE AS Level Economics: The Price System and Microeconomy – Beginner’s Essential Guide, which dives deeper into these interconnected topics.
PED isn’t an abstract idea confined to textbooks; it’s the reason retailers offer discounts on items with elastic demand, such as chocolates, to boost sales volume. Without considering PED, pricing strategies would rely on guesswork, much like making decisions without full information.
Concrete Example
During the 2022 energy crisis in the UK, gas bills increased by 54%, yet short-term demand only fell slightly, with PED estimated at -0.2 according to Ofgem data. People complained but continued using energy because it’s a necessity.
Actionable Takeaways
- List three common items and estimate their PED (elastic or inelastic)—verify this on your next shopping trip.
- When reading news about price increases, consider: Did demand drop significantly or stay steady?
Formulas and Calculations for Price Elasticity of Demand

Time to dive into the math, but don’t worry—it’s more straightforward than it seems, akin to solving a puzzle in a strategy game. The basic formula for PED is the percentage change in quantity demanded divided by the percentage change in price.
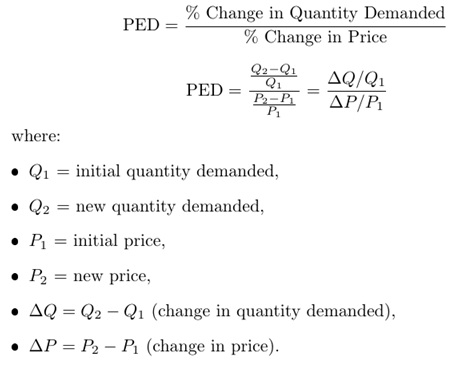
This approach uses proportions, so a 10% price increase affects cheap items differently from expensive ones. To calculate percentage change, use: (new value – old value) / old value × 100. For example, if price rises by 20% and quantity demanded falls by 30%, PED equals -1.5, indicating elastic demand where buyers respond strongly. If you’re brushing up on the mathematical side of these calculations, our No-Sweat Guide to CAIE A‑Level Mathematics 9709 (2025–26) offers helpful techniques for handling percentages and formulas.
For more precision, especially with demand curves, the midpoint formula is recommended in A-level studies. It calculates percentage changes using averages: % change in quantity = (new Q – old Q) / ((new Q + old Q)/2) × 100, and similarly for price. This method avoids bias from whether the price is increasing or decreasing, providing a consistent measure. It’s particularly useful when prices fluctuate frequently.
Let’s apply this with a practical calculation. Suppose the price of coffee rises from £2 to £2.40, a 20% increase using the initial method, and demand drops from 50 cups to 35, a 30% decrease. PED = -30/20 = -1.5. Using the midpoint: Quantity change ≈ 35.3%, price change ≈ 18.2%, PED ≈ -1.94—still elastic, signaling potential sales challenges for sellers. In reality, a 10% spike in US gasoline prices in 2023 led to just a 3.1% short-term demand drop (EIA data), yielding PED ≈ -0.31, which is inelastic since alternatives aren’t immediately available.
These calculations emphasize relative percentage changes, revealing the underlying dynamics of consumer behavior. Modern businesses, like Amazon, use software to compute PED in real-time for dynamic pricing. For students, practicing with sample data helps solidify the concept better than passive reading. To test your understanding, try the CAIE AS Economics – Topic Questions for hands-on practice with elasticity scenarios.
Concrete Example
For a band T-shirt priced from £20 to £25 (25% increase), sales fall from 100 to 70 (30% decrease). PED = -1.2, showing elastic demand among fans who seek alternatives.
Actionable Takeaways
- Use a calculator to work through textbook examples, noting how the negative sign emerges.
- Monitor a product’s price over a week and calculate PED to anticipate your purchasing decisions.
Interpreting PED Coefficients: Size, Sign, and Implications

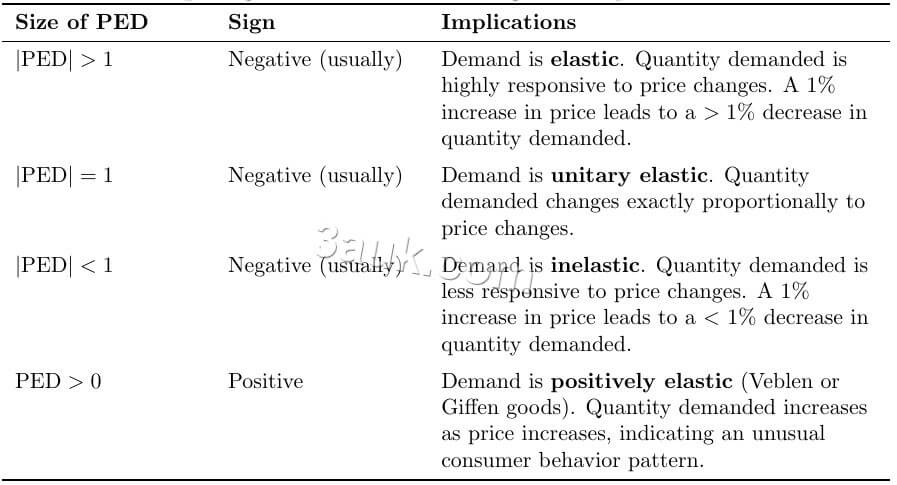
The sign of PED is almost always negative, reflecting the downward-sloping demand curve where higher prices lead to lower quantities demanded. Exceptions exist for Giffen goods, where demand rises with price due to income effects among low-income consumers, but these are rare. We typically use the absolute value to assess the degree of elasticity, concentrating on the coefficient’s magnitude.
If the absolute PED is greater than 1, demand is elastic—quantity changes more than price, indicating sensitive consumers. Less than 1 means inelastic demand, where quantity is less responsive. Exactly 1 signifies unitary elasticity, a balanced point. The importance lies in these relative measures: A small price change causing a large quantity shift suggests abundant substitutes. Elastic goods appeal to consumers with options, while inelastic ones are essentials.
The negative sign reinforces the fundamental law of demand, but the size provides actionable insights. In 2024, clothing items with an average PED of -1.5 saw sales drop 7-8% from 5% price hikes, per retail analyses, whereas pharmaceuticals with -0.3 maintained steady demand. For A-level learners, this percentage-based approach standardizes comparisons, ensuring that proportional impacts are clear regardless of price levels.
PED coefficients can be thought of as indicators of market sensitivity—elastic like quick-changing trends, inelastic like unchanging needs. Companies rely on them for revenue projections; a coefficient of -2 implies a 10% price cut boosts sales by 20%. In exams, linking coefficients to real-world scenarios demonstrates deep understanding. For more on how markets function with concepts like elasticity, our Markets in Action: Edexcel IAL Unit 1 Cheat-Code breaks down key ideas with diagrams and tips.
Concrete Example
Netflix’s 2022 price hike in the UK led to 200,000 subscribers leaving (Ofcom data), with |PED| ≈ 1.2—negative sign and elastic size pointing to easy switches to competitors.
Actionable Takeaways
- Highlight a product’s PED in your notes and summarize its sign and size in a single sentence.
- Discuss with peers: Is smartphone demand elastic? Use a hypothetical calculation to explore.
Types of Elasticity: From Perfectly Elastic to Perfectly Inelastic


Price elasticity of demand exists on a continuum, ranging from extreme responsiveness to none at all. Perfectly elastic demand (PED = ∞) occurs with a horizontal demand curve, where any price increase eliminates demand entirely—common in perfect competition, like identical commodities where buyers switch effortlessly.
Highly elastic demand (|PED| > 1) features a steeper but still downward-sloping curve, typical for luxuries. For instance, a 10% gym membership fee increase might cause a 20% drop in sign-ups as people turn to free alternatives. In 2024, airline fares rose 5%, but bookings fell 12% (IATA data), highlighting elastic responses due to substitute travel options.
Unitary elasticity (|PED| = 1) maintains constant total revenue with price changes, represented by a hyperbolic curve. Digital books often exhibit this; a 10% price reduction attracts exactly 10% more buyers, balancing out revenue.
On the other end, highly inelastic demand (0 < |PED| < 1) shows minimal response, as with necessities. Tobacco has a PED of -0.4 (WHO 2023), so a 10% tax hike reduces consumption by only 4%. Insulin prices in the US doubled from 2012 to 2021 (HCI data), yet demand remained largely unchanged.
Perfectly inelastic demand (PED = 0) is a vertical curve, seen in critical medical supplies like epinephrine injectors during emergencies—price doesn’t affect purchase.
These categories aren’t fixed; they depend on context. For A-level diagrams, illustrate the spectrum from elastic luxuries at the top to inelastic basics at the bottom. Relating to everyday life, elastic demand mirrors trendy gadgets with many choices, while inelastic resembles vital utilities. Dive into detailed notes on these elasticity types with our CAIE AS Level Economics Study Notes.
Concrete Example
During the COVID-19 pandemic, face masks shifted from elastic (novelty items) to nearly perfectly inelastic (essential protection), with demand holding firm despite price surges.
Actionable Takeaways
- Sketch a demand curve and mark regions for different elasticity types.
- Identify elasticity in advertisements: Heavy discounts often target elastic goods.
Variation in Elasticity Along a Linear Demand Curve

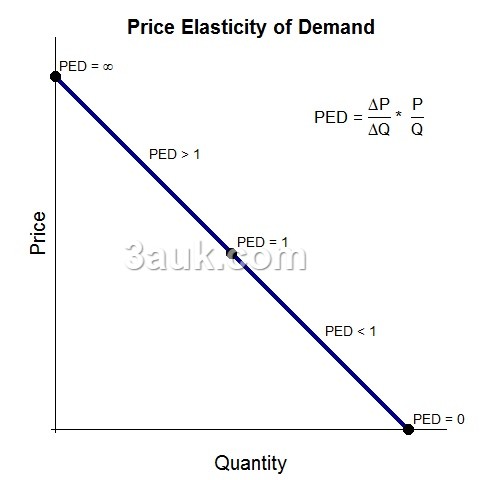
One fascinating aspect is that elasticity varies even on a straight-line demand curve, changing from elastic at the upper end to inelastic at the lower end. This occurs because of percentage calculations: At high prices and low quantities, a price decrease represents a small percentage of the original price but a large percentage of the quantity, making it elastic. Conversely, at low prices and high quantities, the opposite holds, resulting in inelasticity. The midpoint is unitary.
Mathematically, for a linear demand curve like P = 10 – Q, PED can be approximated as – (P/Q) adjusted by the slope. At P=8, Q=2, PED ≈ -4 (elastic). At the midpoint P=5, Q=5, PED = -1. At P=2, Q=8, PED ≈ -0.25 (inelastic).
This variation explains real-market behaviors, such as in 2024 e-commerce fashion where high-priced trendy items at the upper curve are elastic due to competitors, while basic apparel at the lower end remains inelastic. Businesses capitalize on this by targeting the elastic upper section for promotions and the inelastic lower for premium pricing.
Understanding this teaches the importance of position on the curve; total revenue peaks at the unitary midpoint. In A-level assessments, using the midpoint formula at different points showcases analytical skills.
Concrete Example
For budget smartphones, the high-price segment is elastic with abundant alternatives, but the low-price end is inelastic for budget-conscious buyers without options.
Actionable Takeaways
- Create a linear demand graph in your notes and calculate PED at three points along it.
- Examine a real-world demand curve from economic news, like fuel prices, to see elasticity changes.
Factors Influencing Price Elasticity of Demand

Several factors determine whether demand for a good is elastic or inelastic, making PED a dynamic concept. The availability of substitutes is primary: Abundant alternatives, like Coke versus Pepsi, increase elasticity; unique products, such as a specific artist’s music, decrease it. The rise of streaming services in 2024 made Netflix more elastic, with a 12% subscriber shift following price hikes.
Whether a good is a necessity or luxury also matters: Essentials like bread have inelastic demand (average -0.3), while luxuries like vacations are elastic (-1.5). Post-pandemic, travel demand became more elastic with remote work options. The proportion of income spent on the good plays a role—large expenditures like cars lead to elastic demand, small ones like salt to inelastic.
Time frame is critical: Short-run demand is often inelastic, as with gasoline (-0.1 per EIA), but long-run allows adjustments like switching to electric vehicles (-0.7). Habits and brand loyalty reduce elasticity; Apple users show 25% less responsiveness due to loyalty (SSRN 2023). Addictive goods like tobacco remain inelastic at -0.4 (WHO).
Other influences include the definition of the good (narrower definitions are more elastic) and access to information via apps, which heightens comparisons. Inflation can make low-income households more elastic even for basics. For A-level essays, outlining these factors for different scenarios is key, as businesses use surveys to inform strategies, like bulk discounts on elastic poultry at Costco. Learn more about related microeconomic interventions in our Government Intervention in Markets: Essential Guide for A-Level Economics Students.
Concrete Example
Electric vehicles start inelastic in the short run (need for transportation) but become elastic long-term with public transit alternatives.
Actionable Takeaways
- For five products, list influencing factors and predict their elasticity ranking.
- Observe how time alters your habits, like coffee consumption, and recalculate PED.
How Price Elasticity of Demand Affects Total Expenditure

PED directly impacts total revenue (TR = price × quantity), guiding pricing decisions. For elastic demand (>1), a price increase reduces TR because quantity falls more than price rises—like Pepsi’s 2024 hikes (9% up, 7-8% volume down, TR decline). Conversely, price cuts boost TR.
Inelastic demand (<1) works oppositely: Price rises increase TR, as with cigarette taxes yielding 3% higher UK revenue in 2023. Unitary elasticity keeps TR constant. On linear curves, TR is maximized at the unitary point, with elastic regions favoring volume and inelastic favoring margins.
This relationship is essential for businesses like Amazon, which adjust prices algorithmically. Governments target inelastic goods for taxation, such as fuel (-0.3), to raise funds without disrupting consumption. In A-level diagrams, plot TR against price to show the peak at |PED|=1. Amid 2024’s 2.2% CPI inflation (ONS), inelastic groceries helped retailers maintain revenue. For Edexcel students, complement this with insights from the Edexcel A‑Level Economics 2025–2026: Essential Student Guide, which covers similar revenue strategies in microeconomics.
Concrete Example
Elastic airline fares at Ryanair in 2024 saw a 10% cut lead to 15% more passengers, increasing TR significantly.
Actionable Takeaways
- Draw a TR versus price graph, annotating PED zones.
- Observe a retail sale and analyze if TR increased, linking to elasticity.
Applying PED in Business and Policy Decisions

PED empowers informed choices in business and policy. Companies with elastic goods focus on discounts to drive volume, like Starbucks promotions on beverages. Inelastic goods allow price increases for higher margins, as in pharmaceuticals. The goal is often the unitary point for stable revenue.
In policy, taxes on inelastic items generate revenue effectively—the UK’s 2024 sugar levy raised £327 million (HMRC) with minimal consumption drop due to inelastic soft drinks. Fuel taxes support environmental goals on inelastic bases. Monopolies monitor elasticity to prevent consumer backlash. Netflix’s 2024 recovery after hikes relied on inelastic loyalists.
Neglecting PED can lead to poor outcomes, like alienating customers. For A-level, connect it to resource allocation efficiency. Advanced tools like AI now enable real-time PED analysis. Post-Brexit, elastic import demands underscored adaptation needs. To expand on policy applications, check out our CAIE AS Level Economics 2025–2026: Beginner’s Essential Guide.
Concrete Example
In the US, inelastic insulin demand allowed price doubling, boosting TR, but recent policies introduce caps for fairness.
Actionable Takeaways
- Simulate as a CEO pricing an elastic product and explain your strategy.
- Review policy articles and identify PED’s role.
FAQ: Common Questions on Price Elasticity of Demand

1. Is elastic demand beneficial for sellers? It favors volume strategies like discounts but hinders price increases, as quantity drops exceed gains.
2. Why use absolute values instead of the negative sign? The negative confirms the demand law; absolute values simplify sensitivity comparisons.
3. How do substitutes affect PED? More substitutes make demand elastic through easy switching; fewer make it inelastic.
4. Why is long-run PED usually more elastic? Time allows for adjustments, such as new technologies or habits, like transitioning from gas to EVs.
5. Can PED be zero in practice? Nearly so for critical items like medications during emergencies, where demand is unresponsive.
6. Why target unitary elasticity for revenue? It provides balance, ensuring price changes don’t alter total revenue.
7. Examples of income share’s impact? High-share goods like cars are elastic; low-share like matches are inelastic.
8. Ideal goods for taxation based on PED? Inelastic ones, like alcohol or tobacco, allow revenue growth with limited behavioral change.
Wrapping Up: Master PED for Economic Insights
This knowledge isn’t just for exams—it’s for navigating everyday price changes with confidence. Price elasticity of demand equips you to understand why some increases sting less than others, making economics a practical tool for life. For advanced practice, explore the CAIE AS Economics – Topic Questions to apply PED in more complex scenarios.
**Related Articles:**
– Income elasticity of demand GUIDE.
– Cross elasticity of demand GUIDE.
– Price elasticity of supply GUIDE.
References
- Office for National Statistics (ONS). (2024). Consumer price inflation, UK: July 2024. https://www.ons.gov.uk/economy/inflationandpriceindices/bulletins/consumerpriceinflation/july2024
- U.S. Energy Information Administration (EIA). (2023). Short- and long-run gasoline price elasticities. https://www.eia.gov/outlooks/aeo/assumptions/pdf/gasoline.pdf
- World Health Organization (WHO). (2023). WHO report on the global tobacco epidemic. https://www.who.int/publications/i/item/9789240077164
- HM Revenue & Customs (HMRC). (2024). Soft Drinks Industry Levy: Statistics for 2023/24. https://www.gov.uk/government/statistics/soft-drinks-industry-levy-statistics-for-2023-to-2024
- Health Cost Institute (HCI). (2023). Trends in insulin prices and utilization. https://healthcostinstitute.org/hcblog/post/insulin-prices-2012-2021
- International Air Transport Association (IATA). (2024). Air passenger demand analysis. https://www.iata.org/en/publications/economics/
- Simon-Kucher & Partners. (2024). Global pricing study on consumer goods. https://www.simon-kucher.com/en/insights/global-pricing-study-2024