
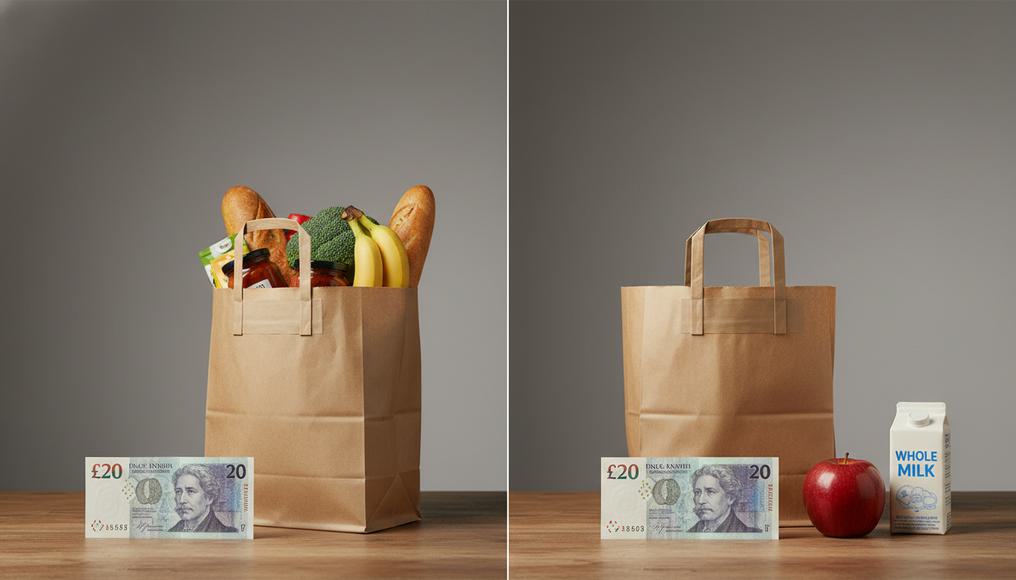
Let’s be real: we’ve all had that moment at the checkout counter where you look at a bag of crisps, then look at the price, and then look at the cashier like they’ve just insulted your ancestors.
Welcome to the world of price changes. Inflation is like that one friend who always insists on taking a “small bite” of your sandwich—before you know it, half your lunch is gone. This isn’t just boring bank talk; it’s the reason your parents won’t stop talking about how a cinema ticket used to cost “a shiny nickel and a firm handshake.”
If you want to know why your savings are sweating or why the price of basic goods feels like a national crisis, stick with me. We’re diving into the mechanics of inflation, deflation, and why “nominal” isn’t just a word people use to sound smart. Understanding how the purchasing power of money shifts is essential for anyone navigating the modern economy, especially if you are just starting your journey with the CAIE AS Level Economics syllabus.

The Vocabulary of Value: Inflation, Deflation, and Disinflation
Before your eyes glaze over, let’s get the terminology straight. Think of the economy like a balloon.
Inflation is when the balloon is expanding. It is a sustained increase in the general level of prices over a period of time. This means the purchasing power of money is shrinking. If £1 bought you ten apples last year, and now it only buys eight, you’re witnessing the effects of inflation. If you are preparing for exams, you can find detailed breakdowns of these concepts in our CAIE AS Level Economics Study Notes.
- Creeping Inflation: This is the “healthy” version. Central banks usually aim for a target rate of inflation of about 2%. It’s like a slow, steady jog—keeps the heart pumping but won’t cause a crisis.
- Hyperinflation: This is when the balloon explodes. Prices rise so fast (often exceeding 50% a month) that money becomes more useful as wallpaper than currency. Famous historical examples include 1920s Germany or 2000s Zimbabwe.
Deflation is the opposite—the balloon is shrinking. It’s a sustained decrease in the general price level. Sounds great, right? Cheap stuff! But wait—if prices keep falling, nobody buys anything today because it’ll be cheaper tomorrow. Businesses go bust, people get hired less, and the whole economy moves into a “vicious cycle” of low growth, often leading to a rise in cyclical unemployment.
Disinflation is just the balloon expanding more slowly. If the rate of inflation was 10% last year but only 2% this year, that’s disinflation. You’re still paying more, just at a less terrifying speed.

Measuring the Madness: The Consumer Price Index (CPI)
How do we actually know things are getting expensive? Economists use a “basket of goods” called the Consumer Price Index (CPI) to perform a measurement of inflation.
Imagine a giant physical shopping basket. Inside, statisticians put the “average” stuff a person buys: bread, streaming subscriptions, petrol, and clothing. This provides a snapshot of the national income and cost of living.
How the CPI is built:
- The Basket: National statisticians pick a representative sample of goods and services frequently purchased by households.
- Weights: Some things are more important than others. If the price of housing goes up by 10%, it hurts a family more than if the price of paperclips goes up by 10%. Therefore, housing gets a heavier weight in the calculation.
- The Base Year: We pick a starting point (let’s call it Year 0) and set its index level to 100.
- The Calculation: Inflation Rate = ((CPI Year 2 – CPI Year 1) / CPI Year 1) x 100
Example of calculating inflation rate using CPI
- Choose a base year: 2012
- Survey and sampling: Collect price data for a market basket of goods and services at selected outlets in different regions.
- Determine weights: Assign weights to each item in the market basket based on a typical consumer’s spending pattern.
Category Item Weight Housing Rent 35% Utilities 15% Food Groceries 20% Dining out 10% Transportation Gasoline 8% Public transport 7% Clothing Clothing 5% - Find out price change for each category: Compare current prices to the prices in the base year for each item in the market basket.
Category Item Base year price Current price Price change Housing Rent $1,200 $1,300 8.3% Utilities $150 $160 6.7% Food Groceries $400 $420 5.0% Dining out $200 $220 10.0% Assuming no price change for other categories (Transportation, Clothing)
- Multiply the weights by the price changes and sum the results to obtain the CPI for the current year.
CPI = (0.35×0.083) + (0.15×0.067) + (0.2×0.05) + (0.1×0.1) + (0.08×0) + (0.07×0) + (0.05×0) = 0.042
This means that the CPI has increased by 4.2% since the base year of 2012.

Challenges in Tracking Price Levels
While it is a standard tool, there are several limitations of CPI and possible difficulties in measurement:
- Substitution Bias: If beef gets expensive, you might buy chicken instead. The CPI basket might still be looking at the beef price, ignoring your savvy shopping habits. (For more on how consumers switch between goods, see our guide on Cross Elasticity of Demand).
- Quality Bias: If a new model of a smartphone costs the same as the old one but has a vastly better camera, you’re actually getting more for your money. However, the CPI just sees a stagnant price.
- New Goods Bias: It takes time for the “basket” to catch up with new technology like VR headsets or emerging digital services.
- Spending Patterns: Everyone is different. A student’s “basket” looks very different from a retiree’s, meaning an average index might not reflect everyone’s reality.
Real Talk: Nominal vs. Real Data
Here is a reality check: Your £1,000 pay rise might actually be a pay cut. This is the vital distinction between money values and real data.
- Nominal Values: This is the face value or “money value.” It is the number actually written on your paycheck or the price tag.
- Real Data: This is the value adjusted for inflation.
Let’s say you get a 5% raise (Nominal). You’re feeling like a boss! But then you find out the inflation rate is 7%. In “real terms,” your real income has actually fallen by 2% because the price of goods grew faster than your bank balance. To understand your true wealth, you must always look at the real value of money and GDP.

Why is This Happening? Demand-Pull Inflation
Inflation doesn’t just wake up and decide to ruin your day. One of the primary causes of inflation is demand-pull inflation.
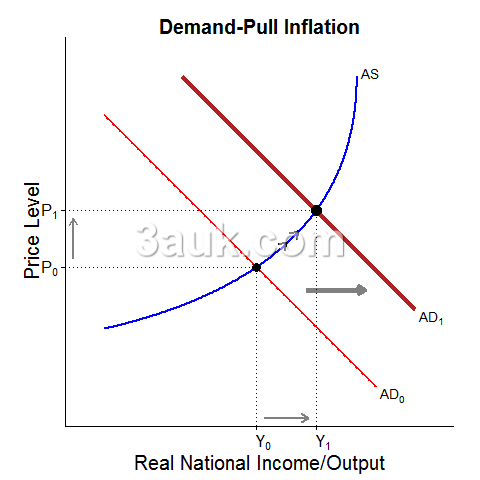
Think of this as “too much money chasing too few goods.” If consumers have high confidence and start spending more—perhaps due to a cut in interest rates or government stimulus—the Aggregate Demand (AD) shifts to the right. When demand exceeds the economy’s ability to produce those goods, the shopkeeper is going to raise the price.

Rising Costs: Cost-Push Inflation
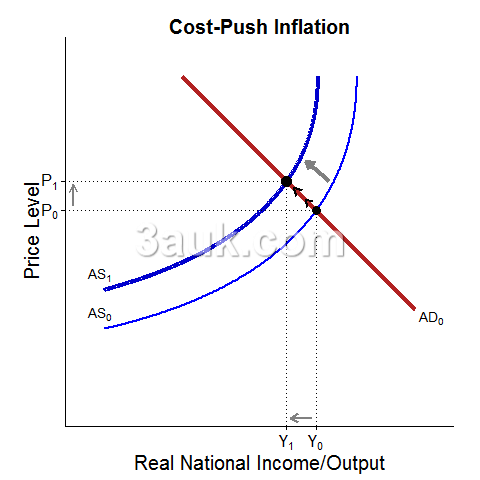
The second major culprit is cost-push inflation. This happens when it becomes more expensive for businesses to actually make stuff, causing a shift in Aggregate Supply (AS), so they “push” those costs onto the consumer.
Common triggers include:
- Rising Raw Material Costs: A sudden spike in global oil prices increases transportation and production costs across the board.
- Wage Increases: If workers demand higher wages and productivity doesn’t keep up, firms raise prices to maintain their profit margins.
- Import Prices: If the local currency weakens, buying components from abroad becomes pricier.

The Consequences: Winners and Losers
The consequences of inflation are not felt equally across society. It creates a shift in wealth that benefits some while penalizing others.
The Losers:
- Savers: If your money stays in a low-interest account while prices rise, your savings are effectively losing value.
- Fixed Income Earners: People on set pensions or wages that don’t adjust found themselves buying less each month. This is one reason why governments often look at wealth redistribution policies.
- International Competitiveness: If a country’s prices rise faster, its exports become too expensive for people abroad.
The Winners:
- Borrowers (Debtors): If you owe £10,000 and inflation skyrockets, you’re paying back that debt with “cheaper” money.

The Hidden Costs of Price Instability
Even if you aren’t a saver or a borrower, inflation brings “hidden” costs to the economy:
- Menu Costs: Businesses have to spend time and money constantly updating their price lists.
- Shoe-leather Costs: The effort people spend searching for the best deals to protect money value.
- Fiscal Drag: This occurs when inflation pushes your nominal income into a higher tax bracket without an actual increase in wealth. This often prompts a debate on government intervention.

FAQ: The Quick Details
Why do we want any inflation?
A small amount of inflation (usually a target rate of 2%) encourages people to spend and invest now rather than waiting. It prevents the economy from stagnation.
What is a wage-price spiral?
This is a cycle where rising prices lead workers to demand higher wages, which causes businesses to raise prices further to cover costs.
Why is deflation scary?
While cheap prices sound good, deflation often leads to consumers delaying purchases, leading to job cuts and recession. You can test your knowledge on these macro-shocks with our CAIE AS Economics Topic Questions.
Congratulations—you now understand inflation better than most people. Whether it’s demand-pull or cost-push, understanding the difference between nominal and real values is the first step to mastering your finances and acing your A-level Economics exams.
References
- Bank of England: What is Inflation? Link
- Office for National Statistics (ONS): Consumer Price Indices Methodology Link
- Federal Reserve: Inflation Basics Link
- International Monetary Fund (IMF): Inflation: Prices on the Rise Link