
Ever stared blankly at a news headline about “economic growth” or “inflation” and felt like you needed a decoder ring for Ph.D. level economists? You’re not alone. But fear not, future economic gurus! We’re about to demystify the core concepts that make an entire economy tick, all without turning your brain into a bowl of alphabet soup. If you’re just starting your journey into the world of A-level economics, you might find our 2025–26 CAIE A‑level Economics (9708) Starter Guide or the CAIE AS Level Economics 2025–2026: Beginner’s Essential Guide to be excellent starting points.
I know, I know. Aggregate Demand (AD) and Aggregate Supply (AS) sound about as exciting as watching paint dry. But what if these two concepts are basically the Beyoncé and Jay-Z of macroeconomics, dictating everything from your grocery bill to your job prospects? Stick with me – your newfound economic savvy will be worth it.

The Economy’s Two Big Bosses: AD and AS Explained
Let’s be real. Understanding macroeconomics without knowing AD and AS is like trying to bake a cake without flour or sugar. It just doesn’t work. Imagine our entire country’s economy as one giant marketplace.

Aggregate Demand (AD): The Nation’s Epic Shopping Spree
Picture this: Aggregate Demand is the total demand for *all* the goods and services produced in an economy at a given price level. It’s essentially everyone’s combined shopping list – from the latest iPhones to government-built bridges. It’s the sum of every dollar spent by every person, every business, and even the government.
We break it down like this, because economists love acronyms:
AD = C + I + G + (X-M)
- C is for Consumer Spending: That new pair of sneakers you bought? Yep, that’s C. Your daily coffee run? Also C.
- I is for Investment Spending: When a company buys a shiny new robot to make widgets faster, or builds a new factory, that’s I. It’s businesses investing in their future.
- G is for Government Spending: When the government builds a new highway, pays its employees, or buys a fleet of military jets, that’s G. Hello, public services!
- (X-M) is for Net Exports: This is our international trade balance – what folks in other countries buy from us (exports, X) minus what we buy from them (imports, M).
- The Downward Slope: Why does the AD curve usually slope downwards? If overall prices fall, your money feels richer (the “wealth effect”), interest rates might drop making borrowing cheaper (the “interest rate effect”), and our goods become cheaper for foreigners (the “exchange rate effect”). All these encourage more spending, hence a movement along the AD curve.

Aggregate Supply (AS): Our Nation’s Gigantic Production Line
Now, if AD is everyone wanting to buy stuff, Aggregate Supply is everyone *making* stuff. It’s the total supply of all goods and services an economy can produce at a given price level. It’s the economy’s entire productive capacity, from farmer’s crops to tech company software.
Here’s where it gets a tiny bit spicy:
- Short-Run Aggregate Supply (SRAS): In the short run, the SRAS curve typically slopes upwards. Why? If prices for products go up, but some costs (like wages) are fixed for a bit, companies suddenly see bigger profits. *Cha-ching!* This motivates them to crank out more goods and services.
- Long-Run Aggregate Supply (LRAS): The LRAS curve is *vertical*. What? Think about it: in the *long run*, an economy’s potential to produce is limited by its actual resources – like how many workers it has, its natural resources, and its technology. Whether prices are high or low, you can’t make more stuff than your resources allow. It’s the economy’s ultimate speed limit! This represents the economy’s *potential output* or full employment output. For a deeper dive into the basic building blocks of an economy, check out our guide on Understanding Scarcity, Choices, and Opportunity Cost or Understanding Factors of Production.

The Difference Between a Dance Move and a Whole New Choreography: Movements vs. Shifts
This, my friends, is where many an economics newbie gets tripped up. This distinction isn’t just academic; it tells us why things are changing.

Movement Along the AD Curve: A Pricey Plié

A movement along the AD curve is like a dancer doing a plié – they’re still on the same stage, just changing their position because the price level changed.
- If the overall price level drops (e.g., from P1 to P2), people suddenly feel wealthier and demand more stuff (from Y1 to Y2). We move down the existing AD curve.
- If the general price level rises, we move up the curve, demanding less. Simple cause and effect due to price. If you want to dive deeper into how demand responds to price changes, our article on Understanding Price Elasticity of Demand might be helpful.

Shifts in the AD Curve: The Entire Dance Troop Moves!

A shift in the AD curve means the *entire curve* picks up and moves – either to the right (more demand) or to the left (less demand). This happens when something *other than the overall price level* changes one of the components of AD (C, I, G, or X-M).
Hot Take coming in 3…2…1: These shifts in the AD curve are what cause economic booms and busts!
- Consumer Confidence (C): If everyone suddenly feels optimistic about their jobs and future, they buy more. (Remember that Beyoncé album drop? Instant spending spree). This shifts AD to the right.
- *Concrete example:* Think about a big tax cut. Suddenly, you have more disposable income. You might buy that new gadget or go on that vacation you’ve been eyeing. All that extra spending from millions of people collectively shifts AD to the right. According to forecasts from sources like S&P Global (2024), potential US fiscal loosening in 2025 through tax cuts or less regulation could boost consumer confidence and spending, pushing AD right.
- Interest Rates & Business Investment (I): When interest rates fall, borrowing money for a new factory or equipment is cheaper. Businesses say, “Sweet, let’s expand!” This shifts AD to the right.
- Government Policy (G): If the government decides to splurge billions on a shiny new national infrastructure project, building roads and bridges, that’s a huge boost to G, shifting AD to the right. For more on how governments can influence markets, explore our guide on Government Intervention in Markets.
- Global Economics (X-M): If our trading partners abroad suddenly get rich and start buying tons of our exports, net exports go up, shifting AD to the right.

Movement Along the AS Curve: Producers Doing the Tango

Just like with AD, a movement along the AS curve (specifically the SRAS) means producers are making more or less solely because the price level changed.
- If overall prices rise, businesses see higher profits (because some costs are temporarily sticky), so they hustle and produce more. We move *up* the SRAS curve.
- If prices fall, profits shrink, and production slows. We move *down* the curve. To understand how supply responds to price changes, our guide to Mastering Price Elasticity of Supply (PES) can offer further insights.

Shifts in the AS Curve: The Whole Supply Chain Goes Off-Script!


A shift in the AS curve means the entire curve moves, either right (more supply) or left (less supply). This happens when things that affect the *cost or ease of production* change – regardless of the selling price.
- Input Prices: If the cost of crucial raw materials (like oil or microchips) suddenly skyrockets, it becomes more expensive for *everyone* to produce. This cuts into profits, so businesses produce less at any given price level, shifting AS to the left.
- *Concrete example:* Remember the Suez Canal blockage (2021)? A giant ship decided to play Tetris in one of the world’s busiest shipping lanes. Supply chains snarled, costs to transport goods shot up, and suddenly it was more expensive to get things made and delivered. This caused a general shift in AS to the left for many goods, contributing to higher prices globally. More recently, geopolitical tensions and protectionist trade policies (like tariffs) have also driven up the cost of intermediate goods, further shifting AS left, according to economists like those at Wells Fargo (2024).
- Technology & Productivity: New inventions or better ways of doing things make production cheaper and more efficient. Think of robots automating tasks. This allows businesses to produce more, shifting AS to the right.
- Labor Force: A sudden increase in skilled workers (maybe through immigration or better education) means more hands on deck, boosting productive capacity and shifting AS to the right.
- Regulations: New, burdensome government regulations can increase the cost of doing business, making it harder to produce, and shifting AS to the left.

Where the Magic Happens: Establishing Equilibrium
Alright, now for the grand finale! Equilibrium in our AD/AS model is where the Aggregate Demand (AD) curve and the Aggregate Supply (AS) curve cross. You feel me? It’s the sweet spot where the total amount of stuff people want to buy exactly matches the total amount of stuff businesses are willing and able to make. This concept is fundamental to understanding market dynamics, much like the interaction of demand and supply in microeconomics.
Finding the Economy’s Balance Point

- At this equilibrium point, the economy settles on a specific real output level (how much stuff is being produced) and a specific price level (the average price of everything).
- And because businesses need people to make stuff, this equilibrium also dictates the level of employment. More output, generally more jobs. Less output, less jobs. It’s not rocket science, just economics!
How Does the Economy Self-Correct?
The economy is a bit like a self-driving car – it tries to keep itself on the road.
- Too much demand? (AD > AS): Prices start creeping up. Businesses see fatter profit margins, so they produce more (moving up AS). Consumers, facing higher prices, start demanding less (moving up AD). Eventually, they meet back at equilibrium, but likely with higher prices and possibly more output.
- Too much supply? (AS > AD): Businesses have unsold stock piling up (inventory bloat!). They start slashing prices. Lower prices mean less profit, so they produce less (moving down AS). Consumers, sniffing a bargain, start demanding more (moving down AD). They eventually meet back at equilibrium, usually with lower prices and less output.
This balancing act is why understanding shifts in the AD curve and shifts in the AS curve are so important. These forces are constantly nudging the economy back to a stable point.

What Happens When a Curve Shifts? Economic Ripple Effects
This is where understanding the “movement vs. shift” distinction truly pays off. When either AD or AS *shifts*, it throws the existing equilibrium out of whack and forces the economy to find a new balance. The effects of shifts in the AD curve and the AS curve on the level of real output, the price level and employment are profound.
When Aggregate Demand Gets a Jolt
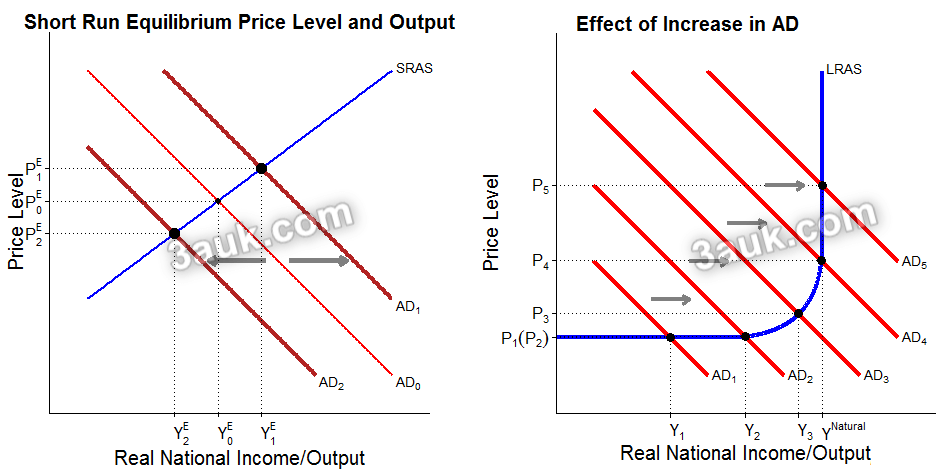
- AD Shifts Right (Increase in Demand): Imagine a huge burst of consumer confidence and government spending – everyone’s buying!
- Effect: The AD curve shifts right. At the old price level, there’s a shortage of goods. Prices start to rise, and businesses respond by producing more.
- Outcome: We end up with higher real output, a higher price level, and increased employment. Yay for jobs and growth, boo for inflation.
- *Concrete example:* The post-pandemic reopening boom (2021-2022) in many countries saw a surge in consumer demand as lockdowns ended and people unleashed pent-up savings. This fueled a rightward shift in AD, leading to robust economic growth and job creation, but also contributed significantly to the inflation we’ve seen.
- AD Shifts Left (Decrease in Demand): Economic recession, anyone? When people stop spending.
- Effect: The AD curve shifts left. Suddenly, there’s a surplus of goods at the old price. Producers cut prices to move inventory and reduce production.
- Outcome: We get lower real output, a lower price level, and decreased employment (think job losses). Not fun.
- *Concrete example:* The infamous housing market crash of 2008 wasn’t just about houses; it triggered a massive decline in wealth and consumer confidence. People stopped spending, businesses stopped investing, and AD shifted sharply left, leading to the Great Recession – massive job losses and economic contraction.
When Aggregate Supply Hits a Snag

- AS Shifts Right (Increase in Supply): This is the good kind of shift!
- Effect: The AS curve shifts right. At the old price level, there’s a surplus. Companies cut prices to sell their extra output, and consumers respond.
- Outcome: We get higher real output, a lower price level, and increased employment. This is the holy grail: more stuff for cheaper!
- *Concrete example:* The “dot-com boom” of the 1990s involved massive technological advancements (especially in computing and the internet). This dramatically improved productivity and efficiency across many industries, effectively shifting AS to the right. This led to a period of strong economic growth with relatively low inflation.
- AS Shifts Left (Decrease in Supply): The dreaded “stagflation” scenario.
- Effect: The AS curve shifts left. At the old price level, there’s a shortage. Prices go up, but because productive capacity is constrained, output *falls*.
- Outcome: We face lower real output, a higher price level, and decreased employment. This is the economic equivalent of a double espresso with extra gloom.
- *Concrete example:* The 1970s oil shocks (when OPEC drastically cut oil production) caused a dramatic leftward shift in AS. The cost of energy, a critical input for almost everything, skyrocketed. This resulted in “stagflation” – high inflation (high price level) combined with economic stagnation and rising unemployment (low real output).
The “Spare Capacity” Cheat Code
Here’s a practical nugget of wisdom: the impact of an AD shift depends heavily on how much spare capacity an economy has. Think of spare capacity as unused resources – idle factories, unemployed workers, etc.

- If the economy has lots of spare capacity (like emerging from a recession), a rightward shift in AD will largely lead to more real output and more jobs, with only moderate price increases. We can easily produce more because we have the resources. For a foundational understanding of economic output, you might find our article on National Income Explained Simply insightful.
- If the economy is close to full capacity (everyone’s employed, factories are humming), a rightward shift in AD will primarily lead to higher prices (inflation), with very little extra output or new jobs. You can’t squeeze much more blood from a stone!

Frequently Asked Questions (FAQs)
Q1: What’s the deal with micro vs. macro? Is it like tiny ants versus giant elephants?
A1: Pretty much! Microeconomics looks at the decisions of tiny ants – individual consumers, single firms, specific markets. Macroeconomics looks at the whole elephant – national economies, overall prices, total employment. They’re related, but focus on different scales. You can explore microeconomic concepts further in our guides like The Price System and Microeconomy or Markets in Action: Edexcel IAL Unit 1 Cheat-Code.
Q2: Can both AD and AS shift at the same time? Does the world ever get that messy?
A2: Oh, my sweet summer child, the world gets that messy *all the time!* A global pandemic example: people stop spending (AD shifts left) AND supply chains get messed up (AS shifts left). The net effect on the economy depends on which curve shifted more dramatically. It’s like a chaotic economic tango. For more on how economic systems allocate resources amidst such changes, you might refer to Resource Allocation in Economic Systems.
Q3: Why does SRAS slope up, but LRAS is straight up and down? What’s the magic trick?
A3: SRAS slopes up because in the *short run*, some costs are “sticky.” Higher prices mean more profit, so firms pump out more. But in the *long run*, all costs adjust, and the true limit is the economy’s resources (labor, tech, capital). Prices won’t magically create more resources, so LRAS is vertical – it’s the economy’s full potential, regardless of price fluctuations.
Q4: “Full capacity” sounds cozy. What does it actually mean for my wallet?
A4: Full capacity means the economy is running on all cylinders – everyone who wants a job has one, and factories are humming. It’s the maximum sustainable output. The downside? If AD keeps trying to increase past this point, you mostly just get *inflation* (higher prices, like your wallet suddenly feeling lighter) without much more actual stuff being produced.
Q5: How do governments play puppet master with AD and AS?
A5: Governments have two main strings:
- Fiscal Policy (G & Taxes): This directly impacts AD. More government spending (“G”) or lower taxes (boosting “C” and “I”) shifts AD right.
- Monetary Policy (Interest Rates): Central banks control this. Lowering interest rates encourages borrowing and spending (“C” and “I”), also shifting AD right.
- For AS, they try Supply-Side Policies – things like investing in education, infrastructure, or deregulation. These aim to make the economy more productive, shifting LRAS right for sustainable growth. You can learn more about how governments intervene and their impact in our article, Government Intervention in Markets: Methods, Impacts, and Effects.
Q6: So, a shift is always good or bad, right? Like, a villain or a hero?
A6: Not quite black and white! A rightward shift in AD is usually “heroic” for growth and jobs, *unless* the economy is already at full capacity, then it turns into an “inflationary villain.” A rightward shift in AS is almost *always* a hero – more stuff for less money! Leftward shifts? Almost always the villain, bringing either recession (AD left) or stagflation (AS left).
Q7: Say “stagflation” again, but with feeling. What is it really?
A7: Stagflation! *cue dramatic horror movie music* It’s the economic monster that combines a stagnant, shrinking economy (low output, high unemployment) with rising prices (inflation). It usually happens when a nasty event (like an oil shock) chokes Aggregate Supply (shifts AS left).
Q8: How can I remember all these AD and AS shifters without needing a flowchart tattooed on my arm?
A8: For AD, remember C+I+G+(X-M). Any change in those *components* (not just the price!) shifts AD. For AS, think of things that change a nation’s ability or cost to *produce*. Key words: technology, input prices, labor, capital, natural disasters. If it makes it easier or harder/cheaper or more expensive to make things, it likely shifts AS! For regular practice on these concepts, make sure to check out our CAIE AS Level Economics Study Notes and CAIE AS Economics – Topic Questions.
Conclusion: You’re Basically an Economist Now (Almost)
Congratulations, you’ve officially earned your stripes in the glorious, slightly chaotic world of macroeconomics! You now understand the primal forces of Aggregate Demand and Aggregate Supply, and how their dance dictates the rhythm of our economy, influencing everything from the price of your morning coffee to the availability of jobs.
This isn’t just theory; it’s the lens through which you can start making sense of news headlines, government policies, and even your own financial decisions. Keep that economic brain humming, ask questions, and soon you’ll be nodding sagely at economic forecasts like a pro. And yes, this *will* be on the test… of life!
References:
- S&P Global Market Intelligence. (2024, June 6). US Fiscal Loosening Seen as a Factor for 2025 GDP Growth. [Economic analysis reports available through subscription].
- Wells Fargo Securities. (2024, May 15). Protectionism and Inflation. Dr. Jay H. Bryson, Chief Economist. [Research reports available publicly or through client access].
- Khan Academy. (n.d.). Macroeconomics. Retrieved from https://www.khanacademy.org/economics-finance-domain/macroeconomics
- Investopedia. (n.d.). Aggregate Demand. Retrieved from https://www.investopedia.com/terms/a/aggregatedemand.asp
- Investopedia. (n.d.). Aggregate Supply. Retrieved from https://www.investopedia.com/terms/a/aggregatesupply.asp