Understanding Demand and Supply Interactions: Economics Beginner Guide
Let’s be real: Economics sounds about as exciting as watching paint dry on a spreadsheet, right? But stick with me, because demand and supply? That’s the Marvel Cinematic Universe of money—full of plot twists, heroes (prices), and villains (shortages) that explain why your coffee costs more than your dignity on Monday mornings. For you A-level newbies fresh from junior high, this is your origin story: We’ll crack open market equilibrium, curve shifts, sneaky market relationships, and how prices play traffic cop. By the end, you’ll spot these forces in every Netflix binge or grocery run. You feel me? If you’re just starting out with CAIE A-level Economics, our friendly starter guide for 2025–26 is the perfect sidekick to build your foundation.
Defining Market Equilibrium and Disequilibrium

Picture this: You’re at a party where the pizza arrives exactly when everyone’s stomach starts growling. No one’s fighting over the last slice, and there’s zero soggy cardboard left behind. That’s market equilibrium in a nutshell—the sweet spot where the amount people want to buy (demand) perfectly matches what sellers are dishing out (supply) at a given price. No chaos, just chill vibes. On a graph, it’s where the downward-sloping demand curve (people buy less when prices skyrocket, duh) crosses the upward-sloping supply curve (sellers crank out more when profits tempt them). Boom: Equilibrium price and quantity locked in.

This isn’t some fairy tale; it’s why your local café doesn’t drown in unused oat milk lattes. Take the UK’s coffee scene in 2023—equilibrium hovered around £3 a cup, with chains slinging about 1,000 units daily without a hitch, per trends from the British Coffee Association. Everyone’s fed, producers aren’t broke. It’s like that perfect group project where no one slacks off.

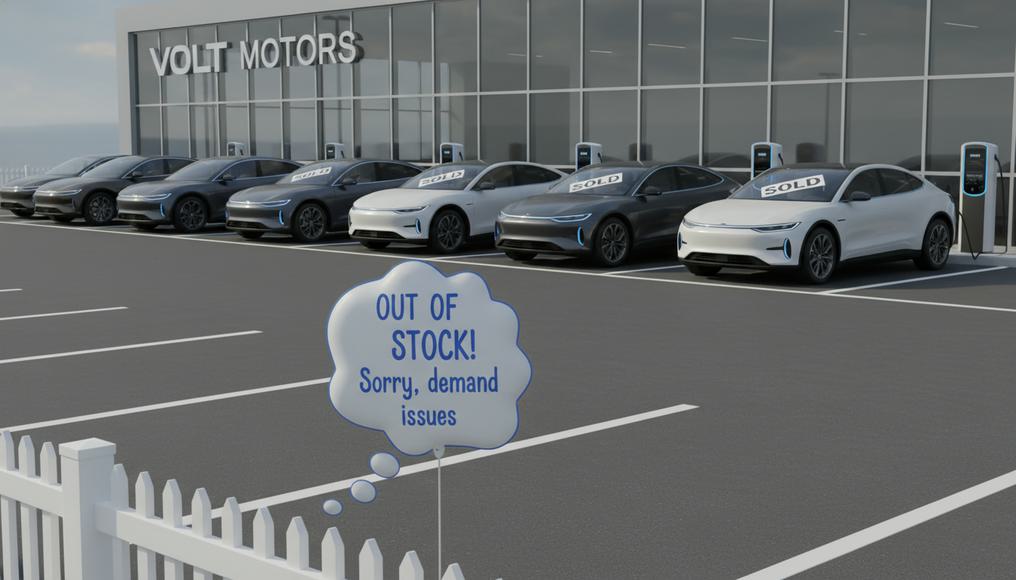
But oh boy, enter market disequilibrium, and it’s party foul city. This is when demand and supply high-five and miss—hello, shortages or surpluses! Shortages? Demand > supply, so queues form faster than fans for a Taylor Swift ticket drop. Surpluses? Supply > demand, leaving sellers with more stock than a Black Friday clearance rack. Prices? They swoop in like superheroes to fix it: Up in shortages to cool the frenzy, down in surpluses to spark buying sprees.
Cue real drama: The UK’s egg market in early 2024. Bird flu aftermath meant supply rebounded post-holidays, but demand took a nap—surplus alert! Prices plunged 20% as supermarkets basically begged you to stock up (Office for National Statistics, 2024). Still reading? You’re a trooper. Disequilibrium’s temporary, but it explains those headline-grabbing petrol price jumps during the 2022 fuel crisis—up 50% as demand outran supply. Master this, and you’ll ace explaining why your groceries aren’t free. And yes, this will be on the test. For a deeper dive into these core concepts like scarcity and resource allocation that underpin equilibrium, check out our guide on scarcity, PPCs, and resource allocation.
Effects of Shifts in Demand and Supply on Equilibrium Price and Quantity
Markets aren’t set-it-and-forget-it gadgets; they’re more like your mood after a bad sleep—shifty and unpredictable. For A-level rookies, shifts in demand and supply curves are the plot thickeners that mess with equilibrium price and quantity. A shift? That’s when non-price stuff (hello, trends or disasters) nudges the whole curve left (less oomph) or right (more hype). Movements along the curve? Just price tweaks. Don’t mix ’em up, or you’ll sound like that guy confusing Star Wars with Star Trek. To get the full picture on the price system driving these shifts, our beginner’s guide to the price system and microeconomy breaks it down step by step.
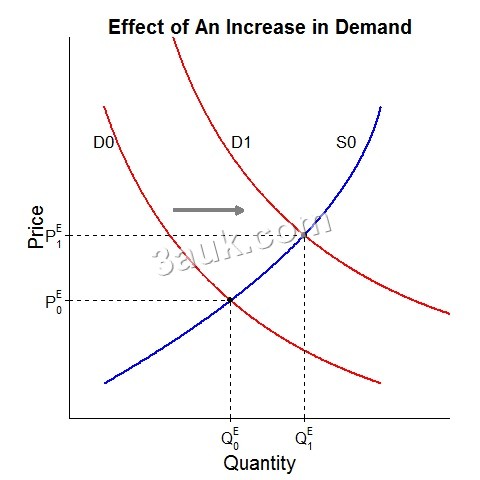
Demand shift first: Rightward boost (more demand) jacks up both price and quantity. It’s competition on steroids—buyers bid wild, sellers smile to the bank. Enter the UK’s electric vehicle (EV) frenzy: 2023’s green vibes and subsidies shifted demand right, sales zipping 12.3% to 272,000 units, nudging prices higher before factories played catch-up (Society of Motor Manufacturers and Traders, 2024). Leftward flop? Price and quantity tank. Coal’s the poster child—eco-shifts dropped UK use 15% in 2023, prices following suit like a sad deflate (Department for Energy Security and Net Zero, 2024). Think of it as your hype playlist: Pumped up? Party grows. Flat? Crickets.
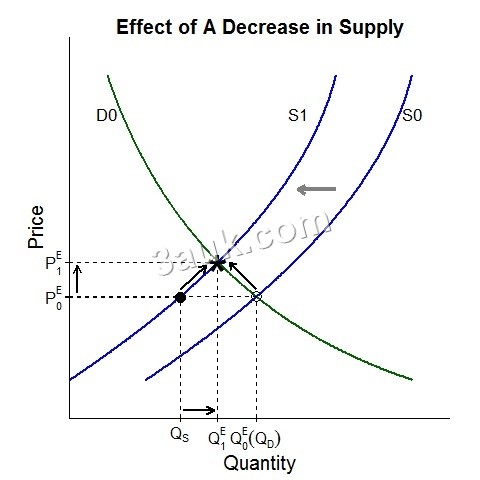
Supply’s the flip side—leftward shrink (costs up, disasters) spikes price, shrinks quantity. The 2022 Ukraine mess hit wheat hard: UK prices leaped from £220 to £320 per tonne by May, quantities cratering 11% from lousy yields (AHDB Agriculture, 2024). Rightward surge? Prices dip, quantity explodes. Solar panels in 2023: Tech drops flooded the market, slashing costs 10-15% and powering up adoption (International Energy Agency, 2024). Cue dramatic pause—what if both shift? It’s a cage match. Demand right + supply left? Prices soar, quantity’s a toss-up. Post-pandemic gadgets: Demand hunger offset chip woes, keeping quantities steady but wallets lighter.
Before your eyes glaze over like a Krispy Kreme, grab a pen: Sketch graphs (price up, quantity across), arrow the shifts, label changes. Fuel’s 2023 rollercoaster—from £1.75/litre peak to £1.65 drop—shows oil volatility in action (Office for National Statistics, 2024). This puzzle-solving skill? It’ll make you the economics whisperer at parties. Pro tip: Always predict the ripple—news like subsidies? Demand right, baby.
Relationships Between Different Markets
Solo markets? Boring. But link ’em up, and it’s like the Avengers assembling—relationships between different markets turn economics into an interconnected blockbuster. One sneeze in coffee beans, and your baker’s toast prices wobble. For beginners, nailing joint demand, alternative demand, derived demand, and joint supply reveals how your smoothie choice echoes through farms and factories. Let’s unlink the knots with zero jargon overload. Dive deeper into these interconnections with resources like our cross elasticity of demand guide for substitutes and complements.
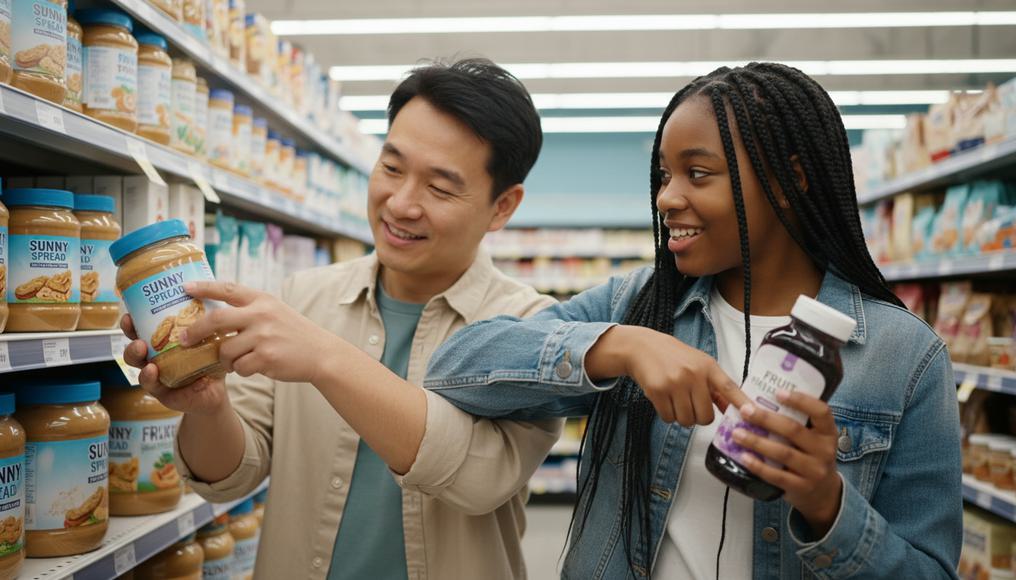
Joint Demand (Complements)
Joint demand (aka complements) is besties territory—goods that hang together like peanut butter and jelly. Demand for one pumps the other. Printer prices tank? Ink sales skyrocket, shifting its demand right and hiking its price. UK’s smartphones in 2023: Sales up 5%, dragging accessories (cases, chargers) along for an 8% quantity boost (Statista, 2024). It’s symbiosis: No lone wolves here. Miss this in exams? You’ll explain half the picture—like why console drops spike game sales.
Alternative Demand (Substitutes)
Flip it: Alternative demand (substitutes) are rivals, swap-outs like Coke vs. Pepsi in a fizz feud. One’s price jumps? Demand shifts right to the other, upping its quantity (and maybe price). Butter woes in 2023—up 12% from weather—sent folks to margarine, steadying spreads (Energy & Climate Intelligence Unit, 2024). Soft drinks? Inflation nudged 10% to cheaper swaps (British Soft Drinks Association, 2024). This keeps markets spicy, no one dominating like a bad sequel.
Derived Demand
Derived demand? The behind-the-scenes star—resources demanded because of final goods. Car craze? Steel and tires get the glow-up. 2020 lockdowns crushed car sales, tanking rubber demand 20% (International Rubber Study Group, 2023). But 2023 EVs? Derived lithium hunger exploded, juicing mining despite snags (UK Critical Minerals Strategy, 2024). It’s the supply chain whisper: Consumers yell, inputs hustle.
Joint Supply
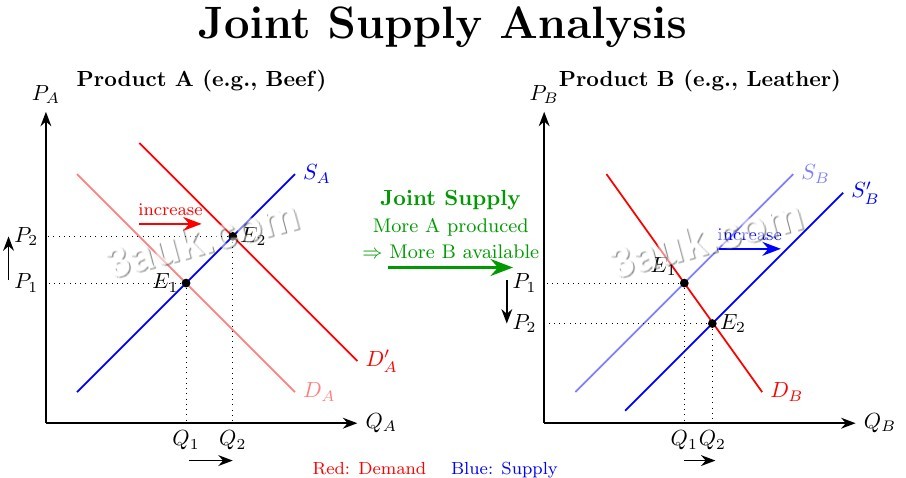
Last up: Joint supply, where one production spits out bonuses. Cattle for beef? Leather’s the sidekick. Beef boom grows herds, flooding leather supply and dropping its price. North Sea oil in 2023: Crude pumps petrol and diesel, stabilizing the latter at £1.70/litre amid chaos (UK Energy in Brief, 2024). Food price hikes added £360 to UK bills in 2023, rippling through complements, subs, and derived farm stuff (European Supermarket Magazine, 2024). Map these dominoes on paper—exams love the web. For a spot-on example, explore our mastering joint supply guide with beef and leather breakdowns.
Self-deprecating aside: I once thought markets were isolated islands. Spoiler: Nope, total myth. These ties? Your secret weapon for holistic answers.
Functions of Price in Resource Allocation: Rationing, Signalling, and Incentivising
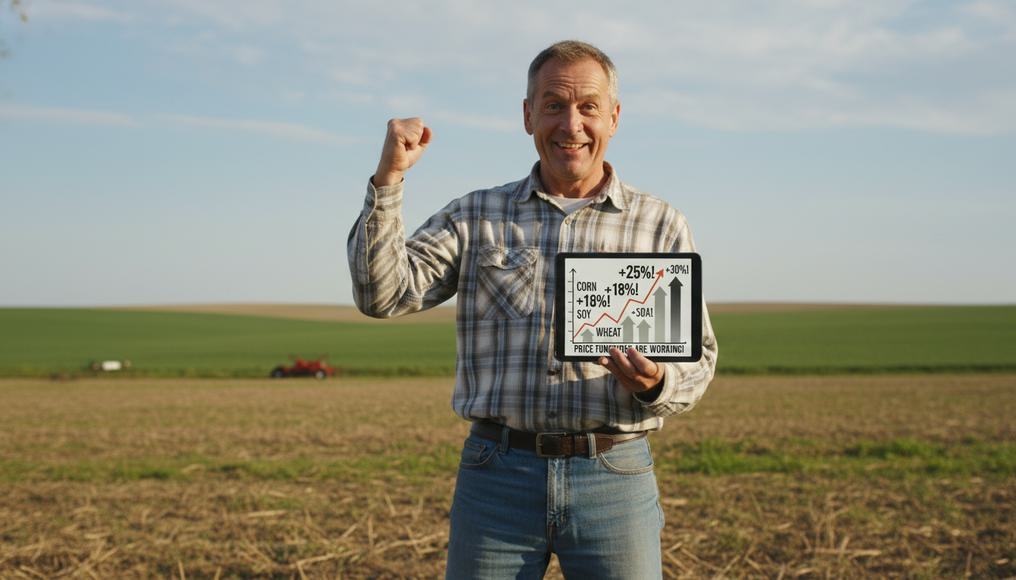
Prices aren’t just numbers on tags—they’re the economy’s sassy DJ, spinning functions of price to allocate resources without a bossy overlord. Rationing, signalling, incentivising: These keep the microeconomy grooving efficiently. For you wide-eyed A-levelers, it’s empowering—no central planner needed. Let’s boogie through, with fresh twists. To see how prices fit into broader resource allocation, our relaxed guide to resource allocation in economic systems ties it all together.
Rationing? Prices gatekeep scarce stuff to high-valvers. Drought? Water prices climb, sidelining pool parties for drinking needs. Europe’s 2023 heatwaves hiked prices, rationing wisely (European Environment Agency, 2024). UK berries post-Brexit? 15% jump prioritized exports over waste (Office for National Statistics, 2024). Without it? Mad Max lines everywhere.
Signalling telegraphs prefs like a cosmic bat-signal. Prices up? “Make more!” Organic eats rose 12.5% in 2023, nudging 5% more UK land green (Soil Association, 2024). Gas crisis? Sky-high bills screamed “Go solar!”—installs up 20% (Department for Energy Security and Net Zero, 2024). Producers listen, markets evolve.
Incentivising dangles carrots for effort. High prices lure investments. Gas peaks post-2022 poured £10bn into UK pipes, dropping bills to £1,928 by mid-2024 (Ofgem, 2024). Cocoa doubled in 2023, sparking African farms and UK choco upgrades (World Bank, 2024). AI? Firm adoption jumped 15% to 22% for gains (ONS Business Insights, 2024). It’s motivation magic.
These trio-tag-team: Shortage rations, signals fixes, incentivises output. Link ’em in essays—like fuel 2022: Prices rationed tanks, signalled imports, boosted rigs. Efficient? You bet. Waste? Minimal. Prices: Economy’s unsung heroes.
Real-World Applications and Case Studies

Theory’s cute, but let’s pop the hood with cases that scream “This affects your life!” Post-2022 fuel frenzy: Reopening demand outran supply—disequilibrium! Prices hit £2/litre, rationing drives, signalling alternatives, incentivising refineries. Eased to £1.65 by 2024 (BBC News, 2022; ONS, 2024). Shifts? Demand right, supply lagging.
AI invasion: ChatGPT’s 2023 hype shifted substitute demand from old software—prices dipped 10-15%, joint demand for chips derived semiconductor booms (Statista, 2024). Wheat war: Supply left from Ukraine, prices up, rationing loaves.
Quick table for visual nerds (no glazing over, promise):
Milton Friedman quipped prices telegraph activity—spot-on for micro-drama. Your wallet’s front-row seat.
Common Misconceptions and Tips for A-Level Exams

Trap alert: Shifts vs. movements—price alone? Slide along curve. External? Shift it. Fuel tax? Movement (less at same P). Green laws? Demand left. Inter-markets? Always probe: “Subs hurt?” To avoid these pitfalls and master elasticity factors that influence shifts, try our price elasticity of demand beginner’s guide.
Tips, because I’m your cheeky mentor:
- Graph obsessively: Axes, labels, arrows. “P↑20%, Q↓10%.”
- Data-drop: “EVs +12.3% like 2023.”
- Combined shifts: Magnitude rules—”Demand wins, Q↑.”
- Price functions: Tie to fixes—”Rations shortage, incentivises more.”
Keep it snappy for 15-markers. Overthink? Nah, clarify. You’ll crush it.
FAQ: Quick Answers on Demand and Supply Interactions

- Market equilibrium, easy mode? Demand meets supply at chill price/quantity—no extras or lacks, like balanced harvest apples.
- Demand upshift’s drama? P and Q both climb—2023 coffee weather woes, per IEA.
- Joint vs. derived demand? Joint: Team-ups like printers/ink. Derived: Ripple from finals, e.g., tires for cars. For more on derived demand’s role, see our income elasticity guide.
- Disequilibrium eternal? Nope—prices pivot: Up for shortages, down for surpluses.
- Price signalling vibes? Hikes yell “Produce!”—vegan trends tell farms to pivot.
- Joint supply snapshot? Beef herds gift leather—beef up, leather floods.
- Incentivising’s power? Lures cash to scarcities, like cocoa spikes birthing farms (World Bank, 2023).
- Subs market magic? Price hike on one? Rival demand surges—Coke up, Pepsi parties.
Wrapping Up: Key Takeaways and Next Steps
Whew, we’ve danced through equilibrium bliss, shift shenanigans, market bromances, and price wizardry— all proving demand-supply’s the microeconomy heartbeat. Ration, signal, incentivise: Prices allocate like pros, from fuel frights to EV highs.
Takeaways: Sketch shifts daily; link markets; quote functions in chaos. Next? Khan Academy vids, BBC econ reads, Bank of England deets. Or level up with our free CAIE AS Level Economics study notes and topic questions for hands-on practice. Apply to your shop: Why’s that snack pricier? You’re equipped, newbie. Go conquer—economics just got fun.
Closing kicker: Who knew supply curves could be this curveball? Now, go ace that A-level.
References
- Office for National Statistics (ONS). (2024). Food and energy price inflation, UK. https://www.ons.gov.uk/economy/inflationandpriceindices
- Society of Motor Manufacturers and Traders (SMMT). (2024). UK EV market report. https://www.smmt.co.uk/market-data/
- AHDB Agriculture. (2024). UK cereals supply and demand estimates. https://ahdb.org.uk/cereals-oilseeds
- Department for Energy Security and Net Zero. (2024). UK Energy in Brief. https://www.gov.uk/government/publications/energy-in-brief
- Statista. (2024). AI adoption trends in the UK. https://www.statista.com/topics/10679/ai-in-the-uk/
- Ofgem. (2024). Energy price cap updates. https://www.ofgem.gov.uk/energy-price-cap
- World Bank. (2024). Commodity markets outlook. https://www.worldbank.org/en/research/commodity-markets
- BBC News. (2022-2024). Various articles on fuel and food markets. https://www.bbc.co.uk/news/business/economy
- International Energy Agency (IEA). (2023-2024). World energy outlook. https://www.iea.org/reports/world-energy-outlook-2023
- British Coffee Association. (2024). Market trends. https://www.britishcoffeeassociation.org/market-insights/
- Energy & Climate Intelligence Unit. (2024). Dairy market report. https://eciu.net/
- British Soft Drinks Association. (2024). Annual report. https://www.britishsoftdrinks.com/
- International Rubber Study Group. (2023). Market analysis. https://www.rubberstudy.com/
- UK Critical Minerals Strategy. (2024). Government publication. https://www.gov.uk/government/publications/uk-critical-minerals-strategy
- UK Energy in Brief. (2024). DESNZ report. https://www.gov.uk/government/publications/uk-energy-in-brief
- European Supermarket Magazine. (2024). Food price impacts. https://www.esmmagazine.com/
- European Environment Agency. (2024). Water scarcity report. https://www.eea.europa.eu/
- Soil Association. (2024). Organic market growth. https://www.soilassociation.org/
- ONS Business Insights. (2024). AI in businesses. https://www.ons.gov.uk/businessindustry