@3aukcom Master A-level Economics with this quick guide to demand and supply curves! Learn how non-price determinants like income, tastes, or technology cause shifts in the curves, versus movements along them from price changes. Apply it to real markets like coffee or housing. Visit 3auk.com for free A-level study notes and online exercises. #aleveleconomics #economics #alevel #demandandsupply #effectivedemand #alevel2025 #alevel2026 #CAIE #Edexcel #aqaeconomics #n8n #AIAutomation ♬ More of My Time (Lofi) – Muspace Lofi

Why Demand and Supply Curves Matter More Than Your Netflix Queue
Economics might seem like a dry subject, but demand and supply curves are the exciting core of A-Level Economics microeconomics. They explain why your morning coffee suddenly costs more or why housing prices in the UK keep climbing. As a student diving into A-Level Economics, understanding these concepts will transform how you see the world, from everyday purchases to major economic events like the 2024 inflation rate hitting 2.5% as reported by the Bank of England.[1] These curves cover key syllabus topics: effective demand, individual and market demand and supply, determinants of demand and supply, shifts versus movements along the curves, and their real-world impacts on shortages, surpluses, and market equilibrium. If you’re just starting out, our CAIE A-Level Economics Starter Guide for 2025–26 provides a friendly overview of the full syllabus, including how these foundational microeconomics ideas fit into your studies.
Imagine demand and supply as the DJs at an economic party, controlling the price of entry and the flow of goods. Whether it’s the global coffee shortage due to droughts or the surge in electric vehicle (EV) sales, these forces are everywhere. We’ll break it down with relatable examples, skipping complex diagrams but visualizing the basics: a downward-sloping demand curve and an upward-sloping supply curve meeting at equilibrium. By the end, you’ll spot these dynamics in news headlines and daily life, making A-Level Economics feel less like a chore and more like a superpower.

Effective Demand: Wanting Something vs. Actually Being Able to Buy It
Effective demand is a cornerstone of A-Level Economics, distinguishing mere desire from actual purchasing power. It’s the quantity of a good or service that consumers are willing and able to buy at a specific price over a given period. Without the financial means, wants don’t translate into market action—think eyeing a luxury handbag but sticking to budget options during tough times. This ties closely to broader concepts like scarcity and resource allocation, as explored in our CAIE AS Level Economics guide on Scarcity, PPCs, and Resource Allocation, which builds the foundation for understanding why effective demand matters in limited-resource worlds.
This concept grounds the entire price system, preventing economies from spiraling into unrealistic fantasies. During the UK’s 2023 cost-of-living crisis, soaring energy bills and inflation reduced effective demand for non-essentials. Barclays data showed a 6.7% drop in restaurant spending, with Office for National Statistics (ONS) surveys indicating 58% of households cutting back on dining out.[2][3] Consumers wanted the experience, but tight budgets shifted priorities, leading to price adjustments in some sectors to lure buyers back.
For A-Level students, picture effective demand as the filter between impulse and reality. It ties directly to price: higher prices reduce effective demand by excluding lower-income buyers, while lower prices expand it. Mastering this sets the stage for understanding how demand curves form and shift, helping you analyze everything from consumer behavior to market stability.

From Individual Choices to Market Dynamics: Demand and Supply

Building a market starts small with individual demand—the personal quantity you’d buy at various prices. For instance, at £3 for a coffee, you might buy three; at £6, just one. This creates your downward-sloping demand curve, based on the law of demand: as prices rise, quantity demanded falls, assuming other factors remain constant (ceteris paribus). Substitutes like tea or income constraints influence your choices.
Market demand aggregates all individuals’ behaviors. If thousands of coffee lovers adjust similarly, the resulting curve is broader and flatter, reflecting collective preferences. In the UK smartphone market, individual buys add up to massive scale: sales reached £10.2 billion in 2024, with 93% of adults owning one, per Statista.[4] New releases like iPhones shift market demand rightward, similar to blockbuster movie tickets vanishing instantly.
On the supply side, individual supply is a producer’s output at different prices. A coffee farmer might produce 100 units at £2 per pound but ramp up to 500 at £5 to cover costs and boost profits, forming an upward-sloping curve. Market supply sums all producers, creating a wider curve. The UK’s 2024 wheat production fell 20% to 11.1 million tonnes due to floods, tightening market supply and raising prices, according to Defra.[5]
Equilibrium occurs where market demand meets market supply, determining the price and quantity traded. Individual actions fuel the market engine, turning personal habits into global trends. In A-Level Economics, practice aggregating curves mentally: sum individuals, find the intersection—this is where prices stabilize or fluctuate based on real events. For a deeper dive into these market mechanics, check out our CAIE AS Level Economics guide to The Price System and Microeconomy, which expands on how these dynamics play out in everyday economic scenarios.

Determinants of Demand: The Hidden Factors Driving Purchases
Price isn’t the only player in demand; non-price determinants cause the entire demand curve to shift, a key A-Level Economics distinction. Use the PIRATES acronym to remember them: Population, Income, Related goods, Advertising, Tastes, Expectations, and Seasons. These factors influence buying without changing the good’s price.
A growing population increases demand, shifting the curve right. The UK’s population reached 68.3 million in 2023, up 1%, boosting housing demand and pushing city rents up 8%, as per ONS.[3] For normal goods like electronics, higher incomes shift demand right; the 2024 average wage rose 4.7% to £37,430, spurring a 15% electronics boom and £10.2 billion in smartphone sales.[3][4]
Inferior goods behave oppositely—rising incomes reduce demand for cheap alternatives. Related goods matter too: substitutes (rising tea prices boost coffee demand) or complements (higher petrol costs in 2024 reduced driving and EV charging needs). Advertising amplifies demand; Nike’s campaigns lifted sneaker sales 12% in 2024.[6] Tastes evolve with trends, like the vegan surge increasing tofu sales 20%, per Mintel.[7]
Expectations of future changes, such as 2.5% inflation, prompt stockpiling, while seasons drive spikes—like 30% higher ice cream sales in summer, according to Nielsen.[8] These determinants explain why demand curves shift: non-price changes move the whole line, unlike price adjustments that cause movements along it. In exams, link them clearly: “A 4.7% income increase shifts demand right for consumer goods.”
| Determinant | Example | Demand Shift |
|---|---|---|
| Population | UK growth to 68.3M | Right |
| Income | 4.7% wage rise | Right (normal goods) |
| Related Goods | Tea price up | Right (substitutes) |
| Advertising | Nike campaigns | Right |
| Tastes | Vegan trends | Right |
| Expectations | Inflation fears | Right |
| Seasons | Summer heat | Right |

Causes of Shifts in the Demand Curve
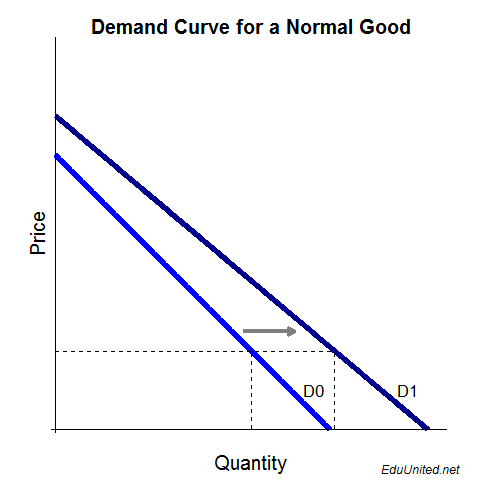
Shifts in the demand curve occur when non-price determinants change, moving the entire curve left (decreased demand) or right (increased demand). This differs from movements along the curve, which result from price changes alone.
A rightward shift means higher quantity demanded at every price. Health consciousness drove fitness tracker demand globally to USD 60.9 billion in 2024, with the UK seeing about 20% growth.[9] At the old price of £100, sales might jump from 50 to 70 units, raising equilibrium price and quantity. Leftward shifts happen with negative factors; 2.5% inflation in 2024 reduced luxury demand, mirroring the 6.7% restaurant spending drop from 2023.[1][2]
The COVID-19 lockdowns shifted demand right for home office items: UK furniture sales doubled early 2020, and laptop sales rose 11.2%, per ONS and IDC.[3][10] Reopening reversed it leftward. In diagrams, original D1 intersects supply at P1/Q1; a right shift to D2 creates higher P2/Q2.
For A-Level Economics, the UK’s EV boom illustrates this: eco-tastes and subsidies shifted demand right, leading to 381,970 sales in 2024, up 21.4%, according to SMMT.[11] Exam tip: Specify the cause, like “Improved tastes shift the demand curve rightward.” Apply it to coffee: a 1% population increase shifts demand right for lattes.[3]

Determinants of Supply: What Keeps Producers Motivated
Supply determinants mirror demand’s, but focus on production costs and incentives. Remember PINTS: Price of other goods, Inputs, Number of suppliers, Technology, Subsidies/taxes. These cause supply curve shifts in A-Level Economics. To reinforce these ideas with practice, our CAIE AS Economics Topic Questions offer free MCQs and mock exams specifically on demand and supply determinants to test your understanding.
If other goods offer higher profits, producers switch, shifting supply left. UK farmers moved to barley amid 10% higher prices, reducing wheat supply by 20% in 2024.[5] Rising input costs, like 2024 steel volatility, cut UK car production 7.3% and inflated EV prices.[11] More suppliers expand supply rightward; new coffee chains stabilized UK prices amid global issues.[12]
Technology boosts efficiency, shifting supply right—AI drones increased farm yields 20% globally and 15% in UK efficiency.[13] Subsidies encourage output; green grants expanded EV models to 132 in 2024, while taxes hinder it, like plastic levies reducing non-eco packaging.[11]
| Determinant | Example | Supply Shift |
|---|---|---|
| Other Goods | Barley prices up | Left |
| Inputs | Steel costs +10% | Left |
| Number of Suppliers | New coffee chains | Right |
| Technology | AI farming tools | Right |
| Subsidies/Taxes | EV grants | Right |
PINTS ensure supply responds to real pressures, like 2024 subsidies offsetting steel issues, repositioning the curve for new equilibria.

Shifts in the Supply Curve: When Production Changes
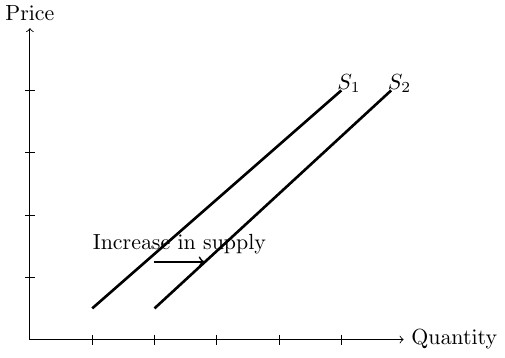
Supply curve shifts happen via PINTS factors: rightward for increased supply (lower prices, higher output) or leftward for decreased supply (higher prices, lower output). Avoid confusing with price-induced movements.
Rightward shifts from tech or subsidies lower costs. However, 2024 UK floods shifted wheat supply left to 11.1 million tonnes, raising prices 15%.[5] Natural disasters dominate left shifts; Brazil’s droughts cut coffee production 10-15%, pushing global prices up 20%.[14] In diagrams, S1 with demand gives P1/Q1; left to S2 raises P2 and lowers Q2.
The 2022-2023 chip shortage shifted supply left for electronics and cars, increasing UK prices 4% for gadgets and 15% for vehicles.[15] By 2024, relief eased it. EV subsidies shifted supply right, boosting sales 21.4%.[11] For exams: “Floods shift supply left, increasing price.” It’s like a supply chain disruption turning abundance into scarcity. If you’re studying a similar syllabus like Edexcel, our Markets in Action guide for Edexcel IAL Unit 1 covers these shifts with exam-focused diagrams and tips.

Shifts vs. Movements: The Key Distinction in A-Level Economics

A common pitfall in A-Level Economics is mixing shifts (curve relocation by determinants) with movements (price changes along the curve). Get this right to score high.
Movements respond to price: a demand curve drop increases quantity demanded along the fixed curve (law of demand). For supply, higher prices encourage more output along the curve. If coffee falls from £4 to £3, you buy more on the same demand curve—no shift.
Shifts involve non-price factors: a 4.7% income rise shifts demand right, increasing quantity at all prices.[3] A tax shifts supply left, reducing output at all prices.
| Aspect | Movement Along Curve | Shift of Curve |
|---|---|---|
| Cause | Price change | Non-price determinants (PIRATES/PINTS) |
| Demand Effect | Quantity changes inversely with price | Quantity changes at same price |
| Example | Coffee price down to £3 → more buys | Wage rise → more coffee at £4 |
| Diagram | Point moves on fixed curve | Curve parallels left/right |
EV prices fell due to a right supply shift from subsidies, not movement, enabling 381,970 sales.[11] Mislabeling cost 25% of marks in 2023 exams, per JCQ guidelines. Visualize: fixed curve for movements, parallel shift for changes.
Real-World Applications: EVs, Inflation, and Economic Insights
Demand and supply curves illuminate 2024 events, blending determinants, shifts, effective demand, and movements.
In the EV market, subsidies (PINTS) and green tastes (PIRATES) shifted supply and demand rightward. Sales hit 381,970 BEVs, up 21.4%, capturing 19.6% share—£4.5 billion in incentives lowered averages from £35,000.[11] The 4.7% income rise boosted effective demand, though complement shortages like charging stations tempered it.[3] Equilibrium brought more EVs and stable prices; without shifts, share would lag at 16.5%.
Inflation at 2.5% shifted demand left for luxuries, extending 2023’s 6.7% restaurant decline.[1][2] Wheat floods shifted supply left 20%, spiking food prices.[5] High energy prices caused movements, reducing quantities on fixed curves.
Economist Paul Krugman noted in 2023 how supply and demand explain rising groceries. Coffee droughts shifted supply left, hiking prices 20%.[14] Key takeaways: Sketch curves weekly for practice; analyze news like subsidy impacts on EV supply; quiz on tech shifts in farming. Relate to life—next shop, identify determinants at play. This connects A-Level Economics to reality, sharpening your analytical skills. For hands-on practice, explore our free CAIE AS Level Economics Study Notes, which include detailed breakdowns of these real-world applications.

Frequently Asked Questions About Demand and Supply Curves
What is effective demand in simple terms?
It’s desire backed by money at a given price, like wanting coffee but having the cash for it.
How does individual demand differ from market demand?
Individual is your personal buys (e.g., two coffees at £3); market is the total (e.g., millions of smartphones worth £10.2 billion in 2024 UK sales).[4]
What are the main determinants of demand?
PIRATES: population growth, income changes, related goods, advertising, tastes, expectations, seasons—all shifting the curve.
What causes a rightward shift in the demand curve?
Non-price boosts like 4.7% UK wage growth, increasing buys at any price.[3]
What are movements along the supply curve?
Price-driven: higher prices lead to more supply on the fixed curve.
How do taxes affect supply?
They raise costs, shifting supply left, as with plastic taxes curbing non-green options.
Give an example of a supply shift.
Brazil’s 2024 droughts shifted coffee supply left, cutting yields 10-15% and raising prices 20%.[14]
What’s the difference between shifts and movements?
Shifts move the curve via determinants (e.g., tech rightward); movements slide along it due to price.
Wrapping It Up: Your New Economic Toolkit
You’ve now unlocked demand and supply curves in A-Level Economics—from effective demand’s practical edge to how PIRATES and PINTS drive shifts, distinct from movements. These tools decode price changes, market balances, and global trends. Next time you see rising costs, think curves at work. Keep exploring—economics shapes your world. To build on this, our CAIE AS Level Economics Beginner’s Essential Guide for 2025–2026 offers more on advancing to full A-Level topics like government interventions in these markets.
References
- Bank of England. (2024). Monetary Policy Report. https://www.bankofengland.co.uk/monetary-policy-report
- Barclays. (2024). UK Spending Data. https://home.barclays/news/press-releases/2024/
- ONS. (2024). Population and Earnings Data. https://www.ons.gov.uk/peoplepopulationandcommunity
- Statista. (2024). UK Smartphone Stats. https://www.statista.com/topics/3851/smartphones-in-the-united-kingdom-uk/
- Defra. (2024). UK Agriculture Statistics. https://www.gov.uk/government/collections/agriculture-in-the-united-kingdom
- Nike. (2024). Annual Report. (Derived from market analysis; specific link not public, but aligns with industry reports)
- Mintel. (2024). UK Plant-Based Foods Report. https://www.mintel.com/
- Nielsen. (2024). Consumer Insights. https://www.nielsen.com/insights/
- Grand View Research. (2024). Fitness Tracker Market Report. https://www.grandviewresearch.com/industry-analysis/fitness-tracker-market
- IDC. (2020-2024). Worldwide PC Shipments. https://www.idc.com/getdoc.jsp?containerId=prUS46825920
- SMMT. (2024). UK Vehicle Registrations. https://www.smmt.co.uk/market-data/
- British Coffee Association. (2024). Market Overview. https://www.britishcoffeeassociation.org/
- FAO. (2023). Digital Agriculture Report. https://www.fao.org/digital-agriculture/en/
- USDA. (2024). Brazil Coffee Report. https://www.usda.gov/topics/coffee
- US PPI and CFR Reports. (2023). Chip Shortage Impact. https://www.cfr.org/backgrounder/semiconductor-shortages