- Topic Questions (MCQ – EASY): Circular Flow of Income, Multiplier
- Topic Questions (MCQ – HARD): Circular Flow of Income, Multiplier
components of Aggregate Demand (AD): Consumption (and Saving)
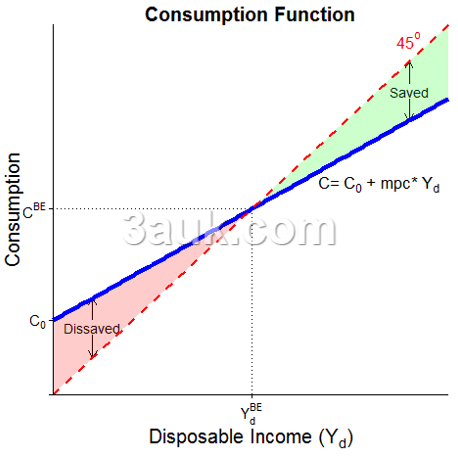
The consumption function represents consumer expenditure on goods and services. It is composed of two components: autonomous consumption and induced consumption.
- Autonomous consumption refers to the level of consumption that occurs even when income is zero or negative.
- It represents the minimum level of consumption necessary for basic needs and is influenced by factors such as government transfers, wealth, and expectations.
- Induced consumption is the additional consumption that occurs as a result of an increase in income.
- It is influenced by the marginal propensity to consume (MPC), which is the proportion of additional income that households choose to spend rather than save.
- average propensity to consume (apc): the proportion of income that households devote to consumption
- consumption/income
- marginal propensity to consume (mpc): the proportion of additional income devoted to consumption
- change in consumption / change in income
C = 20000 + 0.7Yd
C = C0 + mpc ∗ Yd
-
- C0: autonomous consumption (the consumption that is independent of the income level)
- Yd: disposable income (income after tax)
- mpc ∗ Y : induced consumption (the consumption that varies with the income level)
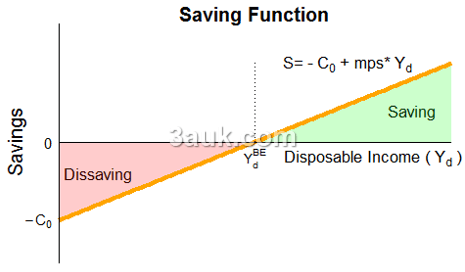
The savings function represents the portion of income that households save rather than consume. Similar to the consumption function, it consists of two components: autonomous savings and induced savings.
- Autonomous savings represent the level of savings that occurs even when income is zero or negative.
- It is influenced by factors such as inherited wealth, financial obligations, and cultural norms.
- Induced savings refer to the additional savings that occur as a result of an increase in income.
- It is influenced by the marginal propensity to save (MPS), which is the proportion of additional income that households choose to save rather than consume.
- marginal propensity to save (mps): the proportion of additional income devoted to saving
- mpc = 1 - mps
S = Yd - C0 - mpc∗Yd = - C0 + (1-mpc)∗Yd = - C0 + mps∗Yd
components of Aggregate Demand (AD): Investment (and Accelerator)
Investment represents the spending by firms on capital goods and infrastructure. It consists of two components:
- Autonomous investment is the level of investment that occurs regardless of changes in income or interest rates.
- It is influenced by factors such as business expectations, technological advancements, and government policies.
- Induced investment is the additional investment that occurs as a result of an increase in aggregate demand.
- It is influenced by the accelerator effect, which states that firms increase their investment when they anticipate higher demand for their products.
- net investment = gross investment - depreciation
- Factors that affect investment
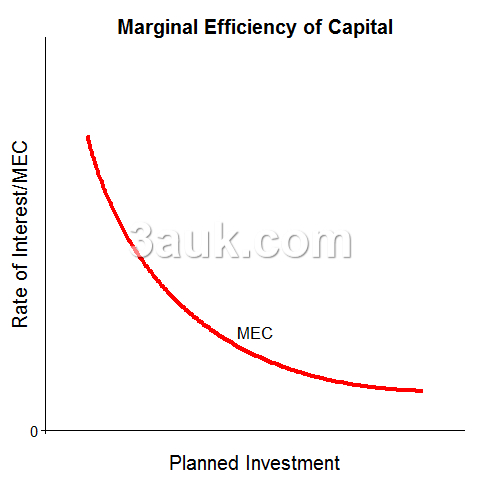
- Interest rate
- (Marginal) Efficiency of Capital / prospective yield of capital
- The rate of economic growth / consumer demand - Accelerator Theory
- Business expectations and confidence
- Access to credit
- The influence of government and regulations: subsidy, capital tax
The accelerator theory
According to the accelerator theory, changes in investment are driven by changes in the rate of growth of national income.
- The accelerator theory proposes that when there is an increase in the rate of growth of national income, businesses respond by increasing their investment spending.
- This is because higher income levels indicate increased demand for goods and services, which in turn creates the need for businesses to expand their production capacity to meet the growing demand.
- Therefore, the accelerator theory suggests that changes in investment spending are not only influenced by interest rates or profitability but also by the rate of growth of national income.
- When income grows, businesses are motivated to invest more to capitalize on the expanding demand for their products and services.
- Conversely, if national income growth slows down or declines, it may lead to a decrease in investment spending due to lower expected demand.
components of Aggregate Demand (AD): Government Spending, Net Exports
Government spending includes all expenditures by the government on goods and services.
- It is determined by government policies, such as fiscal policy decisions related to public infrastructure, defense, healthcare, education, and social welfare programs.
- The Average Rate of Tax (ART) refers to the total amount of tax paid as a percentage of the total taxable income.
- It is calculated by dividing the total tax paid by the taxable income.
- ART provides an overall view of the tax burden on a taxpayer and helps assess the average tax rate for a given income level.
ART = Total Tax Paid / Taxable Income
-
- For example, if a taxpayer earns $50,000 in taxable income and pays $10,000 in taxes, the ART would be: ART = $10,000 / $50,000 = 0.2 or 20%
- The Marginal Rate of Tax (MRT) refers to the tax rate applied to the next dollar of taxable income earned.
- It measures the rate at which additional income is taxed.
- MRT is important because it determines the tax liability on each additional unit of income earned.
- For example, if a taxpayer falls into a progressive tax system where the tax rates increase with higher income levels, their MRT will be the tax rate applied to the highest income bracket they belong to. It reflects the additional tax liability incurred by earning an additional dollar of income.
- The MRT can vary for different income levels due to progressive tax systems, where tax rates increase with higher incomes. In contrast, flat tax systems have a constant MRT throughout different income levels.
Net exports represent the difference between a country's exports and imports.
- They depend on factors such as domestic income levels, exchange rates, foreign demand for domestic goods, and trade policies.
- The Average Propensity to Import (APM) measures the proportion of total income that is spent on imports.
- It is calculated by dividing the total value of imports by the total income in an economy.
APM = Total Imports / Total Income
-
- The APM provides an indication of the average level of import spending in relation to the total income in an economy.
- The Marginal Propensity to Import (MPM) measures the change in imports resulting from a change in income.
- It represents the proportion of additional income that is spent on imports.
MPM = Change in Imports / Change in Income
-
- For example, if a $100 billion increase in income leads to a $30 billion increase in imports, the MPM would be: MPM = $30 billion / $100 billion = 0.3 or 30%
- The MPM reflects the responsiveness of imports to changes in income. It helps in analyzing the impact of changes in income levels on import expenditures.