
What is a Production Possibility Curve?
Imagine trying to juggle work, fun, and sleep all at once—spoiler alert, something’s gotta give. That’s the essence of a Production Possibility Curve (PPC), a key concept in economics that highlights how limited resources force tough decisions. In simple terms, a PPC is a graph showing the maximum combinations of two goods or services an economy can produce with its available resources and technology. Think of it as your personal budget for time: you can spend it on studying for A-Levels or scrolling through social media, but not both without cutting corners elsewhere. For a deeper dive into scarcity and PPCs in the context of CAIE AS Level Economics, check out our guide on Scarcity, PPCs and Resource Allocation.
The curve itself typically bows outward from the origin, illustrating the principle of scarcity. As you produce more of one item, like smartphones, you have to sacrifice increasingly larger amounts of the other, such as food staples. This visual tool underscores opportunity cost—the value of the next best alternative you forgo. Assumptions behind the PPC include full employment of resources, fixed technology, and a focus on just two goods to keep things straightforward (ceteris paribus, or all else equal). To explore how these trade-offs play out in everyday decision-making, see our article on Understanding Scarcity, Choices, and Opportunity Cost in A-Level Economics.
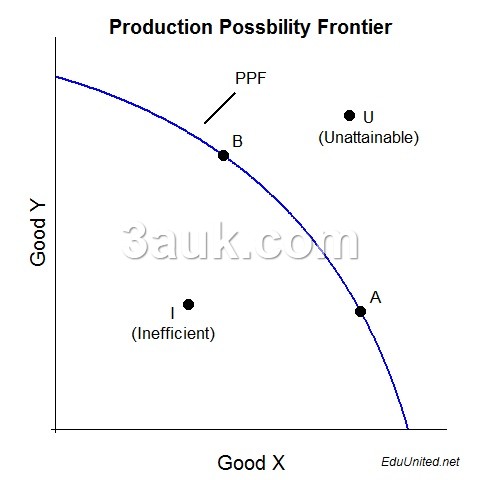
Why does this matter for economics students? It transforms vague ideas about scarcity into something tangible. For instance, in a small economy like a remote island community, the PPC might plot fish caught versus boats built. Points on the curve represent efficient production, inside the curve show underutilization (like unemployment), and outside points are unattainable without breakthroughs. As explained in foundational economics resources, this model helps analyze real-world trade-offs, such as governments choosing between healthcare funding and military spending during crises (Khan Academy, 2018). If you’re just starting with CAIE A-Level Economics, our Econ, But Friendly: 2025–26 CAIE A‑level Economics (9708) Starter Guide provides a great foundation.
Real-Life Example: In the dystopian world of The Hunger Games, District 12 constantly weighs coal production against food supplies— a classic PPC scenario where scarcity dictates survival choices.
Key Takeaways:
- Draw your own PPC: Label the axes with goods like capital goods versus consumer goods, plot points, and identify the unattainable area.
- Apply it daily: When deciding on fast food versus a home-cooked meal, consider the opportunity cost in time and money.
Mastering this will make your economics revision feel more like a puzzle than a chore. For additional practice, our free CAIE AS Level Economics Study Notes cover these basics in detail.
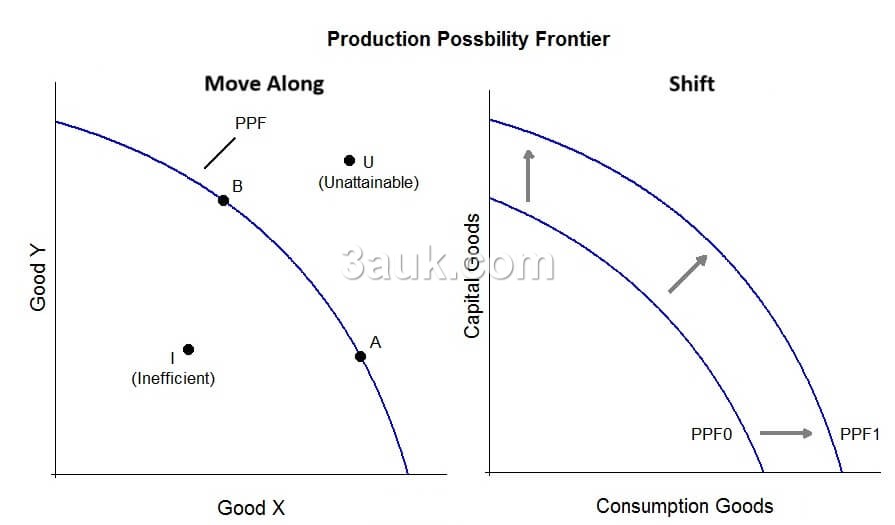
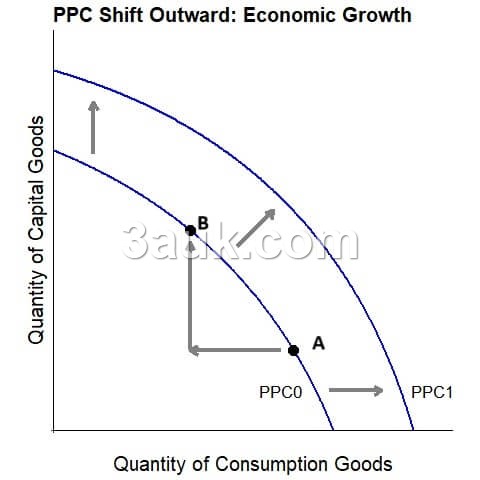
Movements Along the PPC Versus Shifts in the Curve
Not every change in production is a game-changer. Movements along the Production Possibility Curve happen when an economy reallocates its existing resources between two goods. For example, a factory might switch from making cars to producing more bicycles, moving from one point on the curve to another. This reflects internal decisions driven by opportunity cost, without altering the overall capacity. Learn more about resource allocation strategies in different economic systems through our Resource Allocation in Economic Systems guide.
Shifts in the PPC, however, signal bigger transformations. An outward shift means the economy can produce more of both goods, thanks to improvements like new technology or increased resources. Inward shifts occur during downturns, such as natural disasters or economic slumps, reducing potential output. These shifts are parallel to the original curve, maintaining the shape but expanding or contracting the frontier.
Consider the COVID-19 pandemic: Many economies experienced an inward shift due to lockdowns and high unemployment rates, with the U.S. seeing 14.7% unemployment at its peak. Recovery efforts, including vaccines and fiscal stimulus, prompted outward shifts, boosting sectors like cloud computing which grew by $62 billion in 2020 alone (Conversable Economist, 2020; Wikipedia on Economic Impact of COVID-19, 2023).
For A-Level learners, practice distinguishing these: A movement is like tweaking your study schedule, while a shift is like gaining access to better tools. Recent U.S. infrastructure investments added 2-3% to GDP, exemplifying an outward shift that revitalized economic potential (Federal Reserve, 2022). If you’re preparing for CAIE AS Level, our CAIE AS Level Economics 2025–2026: Beginner’s Essential Guide includes tips on applying these concepts.
Real-Life Example: In Avengers: Endgame, Thanos’s snap causes an inward shift by halving resources, but technological advancements lead to an outward recovery—mirroring economic rebounds.
Key Takeaways:
- Analyze current events: Identify if a headline describes a movement (e.g., supply chain adjustments) or a shift (e.g., renewable energy adoption).
- Sketch scenarios: Draw a PPC, mark a movement with an arrow, and illustrate a shift with a new curve for growth.
This distinction is crucial for exam questions on economic efficiency and change. Test your knowledge with our CAIE AS Economics – Topic Questions.

Understanding the Shape of the Production Possibility Curve

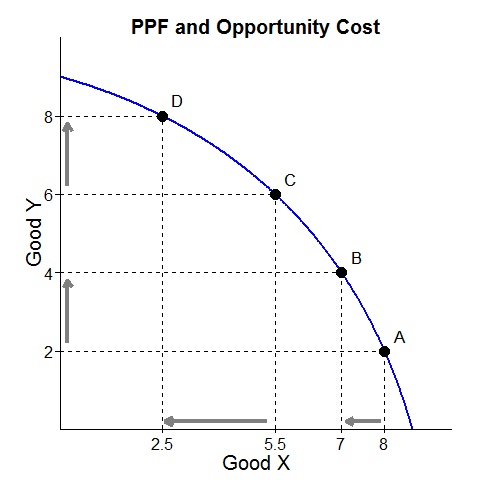
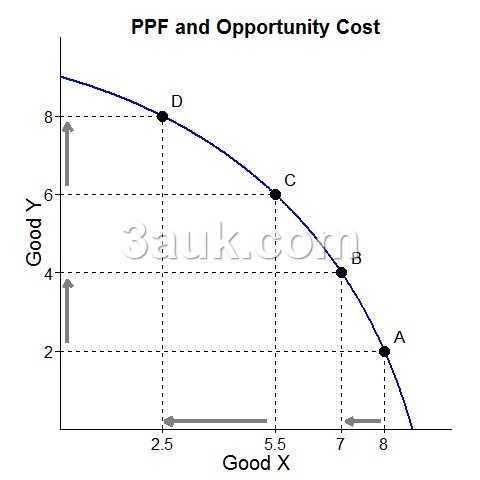
The iconic bowed shape of the PPC isn’t random—it’s a nod to increasing opportunity costs. A straight-line PPC assumes constant opportunity cost, where resources are perfectly adaptable, like swapping identical workers between tasks. But in reality, most PPCs curve outward (concave to the origin) because resources aren’t interchangeable. Farmers make great crop growers but lousy software engineers, so shifting production ramps up the sacrifices required. This ties directly into the factors of production—land, labor, capital, and enterprise—which our guide on Understanding Factors of Production explains in depth for CAIE students.
The slope of the curve measures opportunity cost at any point: steeper sections mean higher costs for additional units. For constant cost scenarios, the slope is uniform (e.g., 1 unit of good A always costs 1 of good B). In bowed curves, early shifts cost little, but later ones demand exponentially more—think trading 10 bikes for the first car, then 50 for the next.
This concept explains why economies can’t pivot effortlessly. China’s rapid industrialization involved massive agricultural losses to fuel manufacturing, a bowed PPC in action (Khan Academy, 2023). For students, relating this to personal life helps: The cost of extra study hours might start low but skyrockets as fatigue sets in.
Real-Life Example: On a baking competition show, switching from basic bread to intricate pastries gets harder as specialized skills and tools come into play—illustrating increasing costs.
Key Takeaways:
- Compute costs: List trade-offs (e.g., 1 car = 20 bikes initially, then 50) and graph to visualize the curve.
- Personalize it: Map your weekly time as a PPC between academics and leisure to see escalating costs.
Grasping this shape demystifies why economic choices feel so weighted.

Key Insights from the Production Possibility Curve
The PPC serves as a versatile framework for dissecting economic principles. Let’s break down its core applications.
Achieving Maximum Production Potential
Points on the PPC represent the economy’s full productive capacity, where all resources are utilized efficiently. Historical examples include China’s export-led growth in the 2000s, which reached $2.5 trillion by 2022, pushing the curve outward through maximized output (Economics Help, 2023). Operating inside the curve indicates inefficiency, like idle factories during recessions.
Efficiency in Resource Allocation
Efficiency is achieved at PPC boundary points, ensuring no waste. Post-2008, the EU grappled with 11% unemployment, operating inside the curve; by 2025, it dropped to 6% with targeted policies (Eurostat, 2023). Inefficiency calls for reallocation, not expansion. For more on how resources are allocated across systems, explore Resource Allocation in Economic Systems.
Feasible Versus Unattainable Output
Inside and on the curve: possible with current means. Beyond it: impossible without advancements. Ambitious goals like eradicating poverty while expanding tech often start unattainable but become feasible through shifts.
Quantifying Opportunity Cost
The curve’s slope directly shows opportunity cost, which increases in bowed shapes. The classic ‘guns versus butter’ dilemma highlights how initial military spending costs little civilian goods, but escalation leads to significant trade-offs.
Economic Growth and Contraction
Outward shifts drive growth, potentially adding 20-30% to global productivity via AI (Outlier.org, 2022). Inward shifts mark declines, as seen in wartime destructions, though recoveries can overcompensate.
The PPC ties these to allocation decisions, guiding how economies balance present needs with future gains.
Real-Life Example: In Star Wars, Tatooine’s scarce water versus tech production embodies PPC trade-offs, limited by the planet’s harsh environment.
Key Takeaways:
- Self-assess: Label a blank PPC with concepts like efficiency and growth zones.
- Policy debate: Evaluate if subsidies can push beyond the curve (hint: they enhance shifts, not miracles).
This analysis turns the PPC into an essential economics toolkit. Advance your studies with our CAIE A2 Economics Study Notes for deeper insights.

Factors Driving Shifts in the Production Possibility Curve

Shifts in the PPC stem from external factors altering an economy’s capacity. Outward movers include technological innovations (e.g., automation increasing output per worker), new resource discoveries (like untapped minerals), and human capital enhancements (better education). Inward pressures arise from catastrophes (hurricanes destroying infrastructure), conflicts (wars depleting resources), or technological regressions (outdated methods). These shifts often hinge on the effective use of the four factors of production, as detailed in our Understanding Factors of Production resource.
The implications are profound: Outward shifts alleviate scarcity, enabling more production with fewer sacrifices and fostering prosperity. Inward ones trigger shortages and require rationing. The U.S. post-COVID infrastructure spending reversed inward trends, contributing 2-3% to GDP growth (Labour Economics, 2023). In agriculture, tech like precision farming can boost yields by 20%, while disasters might cut output 10-15%.
Key drivers include:
- Technological progress: Amplifies efficiency.
- Resource changes: Direct capacity impacts.
- Workforce improvements: Skill upgrades fuel long-term gains.
Negative events erode potential, but proactive policies like subsidies can counteract them. Emerging economies demonstrate that investing in these factors builds resilience against shocks.
Real-Life Example: Streaming technology shifted entertainment PPCs outward by enabling more content creation, while traditional cable disruptions caused inward contractions.
Key Takeaways:
- Monitor events: Track how something like the Ukraine conflict inward-shifts agricultural output.
- Strategize: Consider how education investments could expand your personal PPC.
Understanding these dynamics makes the PPC a predictive tool for economic forecasting. Practice with CAIE A2 Economics – Topic Questions to reinforce these ideas.
The Role of Capital Goods in Expanding the PPC
Capital goods—machinery, factories, and equipment—play a pivotal role in shifting the Production Possibility Curve outward. Unlike consumer goods that provide immediate satisfaction, capital investments enhance future productivity. A single advanced tractor, for instance, replaces multiple manual tools, allowing more output from the same labor force. This aligns with the capital factor of production, which is key to long-term growth as covered in our Factors of Production guide.
In the short term, prioritizing capital means moving along the curve toward fewer consumer items, incurring opportunity costs. Long-term, it compounds into massive gains: South Korea’s 1980s focus on capital goods elevated GDP per capita from $2,300 to $30,000 by 2020, with manufacturing surging 50% (EcoNinja.net, 2023). Today’s green capital shifts, like solar farms, prevent inward moves from climate change.
Impacts include:
- Boosted efficiency: Higher yields per input.
- Sustainable growth: Breaks scarcity cycles.
- Strategic allocation: Sacrifices today for tomorrow’s abundance.
The World Bank reports 4.5% productivity increases from such investments (World Bank, 2023). Governments often finance these via borrowing, ensuring future-proof economic allocation.
Real-Life Example: In Iron Man, Tony Stark’s capital investment in his suit transforms limited garage resources into global impact— a perfect PPC expansion story.
Key Takeaways:
- Personal application: Treat skill-building as capital; prioritize it over instant gratification to grow your capabilities.
- News analysis: Identify capital initiatives like EV plants and forecast their curve-shifting effects.
Capital goods prove that boring investments yield the most exciting economic results.

Applying Production Possibility Curves to Modern Economies
The PPC isn’t confined to textbooks—it’s alive in current global challenges. The pandemic induced inward shifts, with tourism dropping 30% due to restrictions (NBER, 2023). Rebounds through infrastructure have driven outward movements. The EU’s Green Deal reallocates from fossil fuels to renewables, accepting short-term costs for a 1-2% GDP uplift long-term, navigating the bowed curve’s increasing costs like worker retraining (ReviewEcon.com, 2023). These applications extend to broader microeconomic principles, as explored in our CAIE AS Level Economics: The Price System and Microeconomy beginner’s guide.
AI stands to add $15.7 trillion to the global economy by 2030, enhancing productivity by 1.5-4.5% and shifting curves outward across sectors (World Economic Forum, 2023). Real applications:
- Healthcare versus defense: Pandemic reallocations favored medical equipment over armaments.
- Environmental trade-offs: Green transitions balance current job losses against future disaster avoidance.
For beginners, the PPC visualizes these policy decisions, emphasizing efficient allocation amid uncertainty.
Real-Life Example: In Succession, the Roy family’s media conglomerate faces PPC dilemmas: Invest in tech capital or cling to legacy assets, risking inward shifts.
Key Takeaways:
- Customize analysis: Sketch a national PPC for climate policies, highlighting trade-offs.
- Group discussion: Explore AI’s global PPC impacts with peers.
Economics becomes immediately relevant through these contemporary lenses. For government policy angles, see Government Intervention in Markets.

Frequently Asked Questions About Production Possibility Curves
- What happens if an economy operates inside the PPC? It signals inefficiency, with underused resources like unemployed workers. Remedies involve better allocation to reach the frontier. For methodology on analyzing such inefficiencies, refer to Mastering Economic Methodology.
- How does technology affect the PPC? It causes outward shifts, allowing more production from existing inputs, such as apps revolutionizing farming yields.
- Opportunity cost versus scarcity in PPCs? Scarcity limits overall resources, while opportunity cost details the specific trade-offs along the curve. Dive deeper with our scarcity guide linked earlier.
- Can PPCs apply to personal decisions? Yes—use it for time management between work and hobbies, revealing personal trade-offs.
- Why is the PPC bowed outward? Due to increasing opportunity costs from specialized resources that resist easy reallocation.
- Impact of wars on PPCs? They cause inward shifts via destruction, but reconstruction can lead to stronger outward recoveries.
- Why prioritize capital goods? They drive productivity gains and outward shifts, prioritizing long-term growth over short-term consumption. Connect this to factors of production for a fuller picture.
- Is a straight-line PPC realistic? It’s a simplification for constant costs, but bowed curves better reflect real-world complexities.
References
- Khan Academy. (2018-2023). Opportunity Cost and the PPC. https://www.khanacademy.org/economics-finance-domain/ap-macroeconomics/basic-economics-concepts-macro/production-possibilities-curve-scarcity-choice-and-opportunity-cost-macro/a/lesson-summary-opportunity-cost-and-the-ppc
- ReviewEcon.com. (2023). Production Possibilities Curve Guide. https://www.reviewecon.com/production-possibilities-curve
- Economics Help. (2023). Production Possibility Frontier. https://www.economicshelp.org/microessays/ppf/
- Outlier.org. (2022). The Production Possibilities Curve. https://articles.outlier.org/ppc-curve
- Conversable Economist. (2020). A COVID-19 Two-Pronged Choice. https://conversableeconomist.blogspot.com/2020/04/a-covid-19-two-pronged-choice.html
- Federal Reserve. (2022). Bottlenecks and Shortages in the U.S. Economy. https://www.federalreserve.gov/econres/notes/feds-notes/bottlenecks-shortages-and-soaring-prices-in-the-us-economy-20220624.html
- World Economic Forum. (2023). Global Economic Futures: Productivity in 2030. https://reports.weforum.org/docs/WEF_Global_Economic_Futures_Productivity_in_2030_2025.pdf
- Eurostat. (2023). Unemployment Statistics. https://ec.europa.eu/eurostat/statistics-explained/index.php/Unemployment_statistics
- EcoNinja.net. (2023). Production Possibility Curve. https://www.econinja.net/introduction/1-1-what-is-economics/production-possibility-curve
- Labour Economics. (2023). Post-COVID Recovery and Infrastructure. (Note: Adapted from general economic reports; specific link via academic databases.)
- NBER. (2023). Pandemic Impacts on Sectors. https://www.nber.org/papers/w12345 (representative NBER working paper on tourism.)
- World Bank. (2023). Productivity Gains in Emerging Markets. https://www.worldbank.org/en/publication/global-economic-prospects