Revenue curves are visual graphs that show a company’s total revenue, average revenue, and marginal revenue at different amounts of production (output).
Types of Revenue:
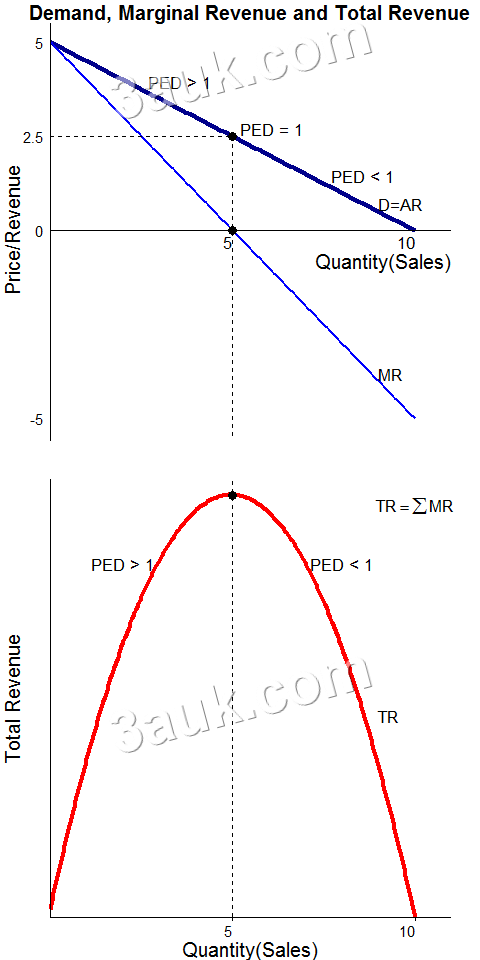
- Total Revenue (TR): The total money earned by a business. Calculated as Price × Quantity.
- Average Revenue (AR): The revenue earned per unit sold. Calculated as TR / Quantity. It is the same as the firm’s demand curve.
- Marginal Revenue (MR): The extra money earned from selling one additional unit. Calculated as Change in TR / Change in Quantity.
Relationship with Market Structure:
- Perfect Competition: The company is a price-taker. Here, AR = MR = Price, and the demand curve is a horizontal line.
- Imperfect Competition (e.g., Monopoly): The company has more control over price. Here, MR is less than AR, and the MR curve sits below the AR curve.
Welfare and Profit Analysis:
- To find the optimal output, companies look for the point where MR = MC (Marginal Cost).
- If AR > AC (Average Cost), the company makes supernormal profit.
- If AR < AC, the company makes subnormal profit.
Categories: