
Picture This: The Stark Reality of UK Wealth Inequality
Imagine glancing at a pie chart showing UK wealth distribution and realizing the top slice dwarfs everything else—like a Game of Thrones feast where a few lords hog the entire table. That’s the essence of income and wealth inequality in the UK, a pressing issue that feels more like a real-life drama than abstract economics. If you’re just starting your A-level economics journey, get ready to explore how governments use clever microeconomic policies to redistribute resources more fairly. For a solid foundation, check out our Econ, But Friendly: 2025–26 CAIE A‑level Economics (9708) Starter Guide. No superheroes needed, just smart strategies to tackle the divide.

The Harsh Truth of Income and Wealth Inequality in the UK
In today’s world, where the wealthiest grab over 30% of total income while the bottom half scrapes by with less than 5% of wealth, it’s easy to see why calls to ‘eat the rich’ trend online. This income and wealth inequality isn’t mere entertainment—it’s a barrier to affordable housing, quality education, and social mobility. For those new to economics, this falls under microeconomics, focusing on individual-level interventions like raising wages or adjusting taxes to spread wealth without derailing the economy.

Looking at 2024 UK data, the picture is striking: the Gini coefficient for income has improved slightly to 32.9% from 33.1% the previous year, but wealth inequality remains severe at 74.6%. This means the bottom 50% of households hold less than 5% of total wealth, while the top 10% control 57%. Regional disparities exacerbate the issue, with median wealth in the North at about half that of the South East, a legacy of post-pandemic economic shifts. These divides fuel social unrest and hinder growth, but policies such as minimum wages and targeted taxes offer hope for balance. Keep reading to discover how these mechanisms work—no dull lectures here.
It’s relatable: think of a friend struggling with rent on a minimum-wage job in a big city.

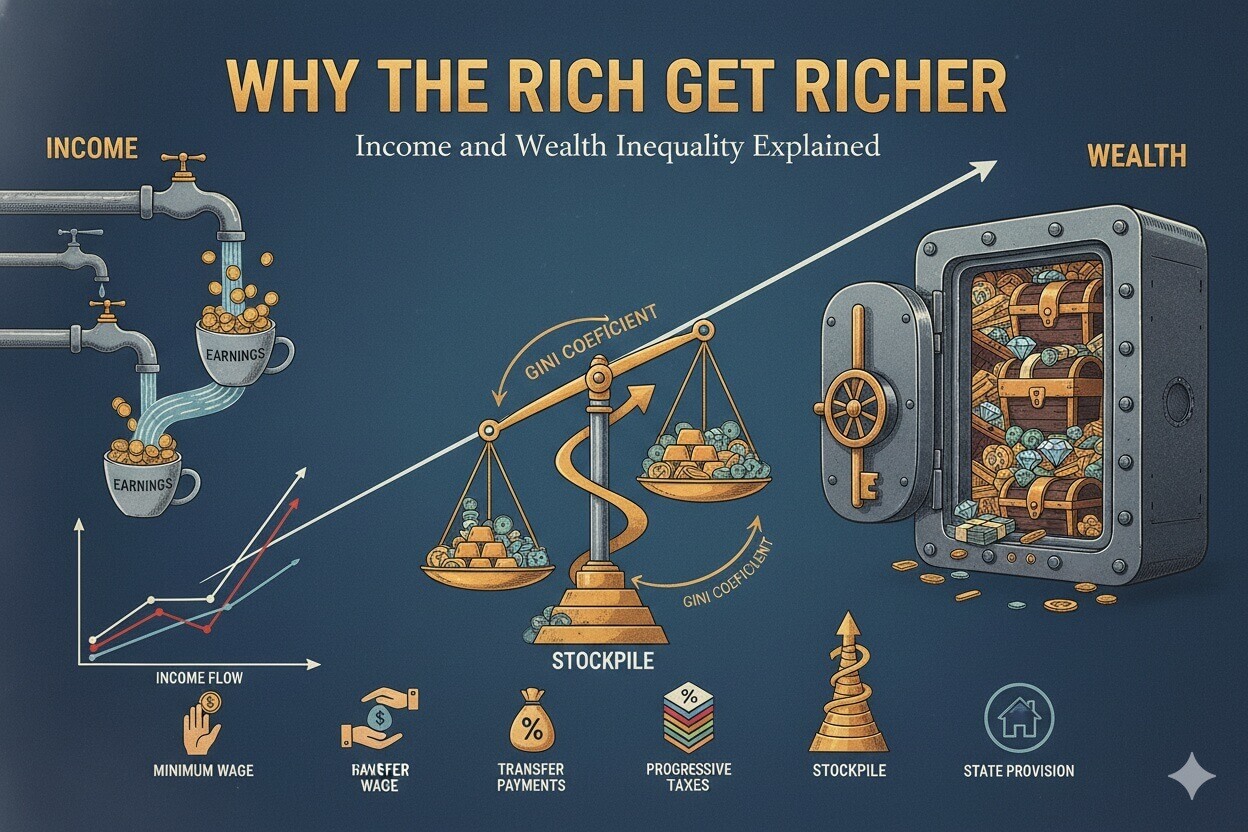
Income as Flow vs. Wealth as Stock: Key Concepts for Understanding Inequality
To grasp income and wealth inequality, first distinguish between income as a flow concept and wealth as a stock concept. Income is like a stream of water—ongoing earnings from salaries, gigs, or investments that flow in over time. It’s dynamic; one month you might thrive, the next face setbacks from job loss. In the UK, median household income stood at £32,300 in 2022, but real terms have fallen 1.6% since 2019 due to inflation, hitting lower earners hardest as living costs soar.
Wealth, conversely, is a stock concept—a accumulated snapshot of assets like property, pensions, and savings minus liabilities. It grows steadily for the affluent through investments and appreciation, much like a snowball gaining momentum. For instance, owning a £300,000 home with a £100,000 mortgage yields £200,000 in net wealth. Yet, averages vary wildly: £350,000-£400,000 in the South East versus £150,000-£200,000 in the North, driven by booming property values post-pandemic. Homeowners see gains on paper, while renters build no stock.
This flow-stock distinction is crucial for measuring income and wealth inequality and crafting policies. Boosting income flows via wage supports helps immediate needs, while taxing wealth stocks prevents generational hoarding. Neglect it, and inequality entrenches like a bad habit. Governments recognize this: minimum wages enhance flows, and inheritance taxes curb excessive stocks. Pause for effect: Understanding this duo will sharpen your analysis of economic fairness.
Practical Tip: When reviewing your finances, categorize earnings as ‘flow’ and assets as ‘stock’—it clarifies policy impacts instantly.

Demystifying the Gini Coefficient: How We Measure Inequality
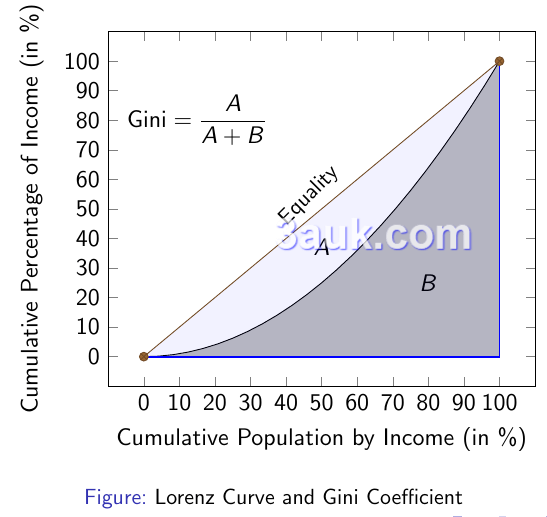
Enter the Gini coefficient, a straightforward tool for quantifying inequality without needing a calculator. Ranging from 0 (perfect equality, everyone shares equally) to 1 (total inequality, one person holds everything), it’s derived from the Lorenz curve—a graph showing income or wealth distribution. A straight line indicates equality; a bowed curve signals disparity.
For the UK in 2024, the income Gini coefficient is 32.9%, a modest level that’s edged down and improved from pre-2011 highs. Wealth fares worse at 74.6%, where the top 20% claim 60-65% and the bottom 50% just 10%. Before housing costs, income Gini is 35%; after, it rises to 39%, highlighting how expenses amplify divides. In London, the top 10% take 32.3% of income versus 24% for the bottom 50%, exceeding England’s 27.6% average.
Wealth inequality has intensified, with the top 10% holding 57%—up from 52.5% in 1995—largely due to inheritances. The Lorenz curve visually captures this: early segments balloon for the rich, leaving little later. These metrics reveal policy successes, like taxes moderating income inequality, and challenges, such as persistent wealth gaps, informing interventions like expanded benefits.
If you’re still engaged, kudos—many glaze over at curves.
Real-Life Parallel: Like in Harry Potter, low Gini means equal access to magic school; high Gini favors the elite houses with endless vaults.
Practical Tip: Search for a Lorenz curve diagram and doodle it in your notes—perfect for visual learners. For deeper dives into basic economic ideas like scarcity and resource allocation that underpin inequality, explore our CAIE AS Level Economics: Scarcity, PPCs and Resource Allocation guide.

Unpacking the Causes: Economic Factors Driving Income and Wealth Inequality
Income and wealth inequality arises from market forces, social barriers, and policy gaps, not chance. Post-pandemic, the poorest saw incomes drop 7.5% in 2022 while the richest rose 7.8%—a stark divergence. Let’s examine the culprits.
Markets lead the charge: supply and demand rewards high-skill roles like tech, but undervalues low-skill ones, with 20% of UK jobs low-paid, such as retail or hospitality. Globalization eliminated manufacturing, shifting to service economies. Asset inflation, especially housing, propelled wealth-to-income ratios from 2.3:1 in 1948 to 5.7:1 in 2020, benefiting owners over renters.
Education acts as a filter: graduates earn 50% more over lifetimes, but access issues leave low-income youth with 20% higher unemployment, stunting both flows and stocks. Inheritances perpetuate cycles—the top 10% derive 57% of wealth from family, versus nothing for the bottom 50%. Regional biases favor the South East’s property inheritances over the North’s limited opportunities.
Discrimination compounds it: women’s pay gap at 14% (narrower at 6.1% for low earners), ethnic minorities trailing 10-15%. Inflation peaked at 11% in 2022, leaving 11% unable to heat homes (up from 4%). Economic shocks and regressive taxes on consumption over wealth solidify divides. As the OECD notes, inequalities stifle mobility— the rich compound advantages, the poor remain stuck.
Humor break: If equality ruled, I’d pen this from a private jet, not my desk.
Everyday Example: Picture a superhero saga—high-flyers like tech innovators thrive, while everyday workers struggle; policies must unite them.
Practical Tip: Build skills with free resources like online courses to avoid low-wage pitfalls. Practice with our CAIE AS Level Economics Study Notes and CAIE AS Economics – Topic Questions.

Government Strategies: Microeconomic Policies to Reduce Inequality
UK governments actively combat income and wealth inequality through microeconomic tools, lowering the income Gini by 1-2 points since 2010 despite inflationary pressures. Here’s the arsenal, ethically redistributing like modern Robin Hoods. For a comprehensive overview, dive into our Government Intervention in Markets: Essential Guide for A-Level Economics Students.
Minimum Wage: Setting a Fair Baseline for Earnings
The minimum wage establishes a wage floor, with the UK’s National Living Wage at £11.44 per hour in 2024 for those 21+, aiding over 2 million workers and reducing poverty risk by 0.4 percentage points. It has decreased low-paid jobs by 10%, particularly benefiting women (18.7% in low-pay roles) and narrowing gender gaps. While sectors like hospitality saw minor 1-2% employment dips post-increases, overall gains outweigh costs—envision entry-level pay supporting real life, not just survival.
Transfer Payments: Direct Support to Stabilize Incomes
Transfer payments, such as Universal Credit, support 6 million households with seamless benefits. During 2023’s cost-of-living crisis, £301 payments prevented 500,000 from falling into poverty, cushioning utility bills. Universal Credit streamlined £3.6 billion in adjustments, though 10% faced delays. The Institute for Fiscal Studies (IFS) credits transfers with cutting inequality by 15%—a vital net for economic turbulence.
Insight: Absent these, daily struggles would overwhelm more families.
Progressive Taxes: Targeting Higher Incomes and Assets
Progressive income taxes escalate with brackets—20% basic, 40% higher, 45% additional—reducing the top 20%’s earnings multiple from 6.3 times the bottom pre-tax. This funds public services. Inheritance and capital taxes address stocks: inheritance tax at 40% above £325,000 (up to £500,000 with reliefs) generated £7.1 billion in 2022-23; capital gains tax at 10-28% taxes profits. Strengthening these could lower wealth Gini by 5%, mirroring Europe’s 20% inequality reduction since the 1990s, per OECD data—despite evasion loopholes curbing dynastic wealth. Learn more about methods and impacts in our Government Intervention in Markets: Methods, Impacts, and Effects for A-Level Economics.
State Provision: Accessible Essentials for All
State provision of services like the NHS and free education lowers barriers, enhancing effective incomes. The NHS saves low-income families £2,000+ annually on healthcare, avoiding debt traps. Scotland’s fee-free university since 2007 reduced youth inequality by 3%, offering debt-free paths compared to England’s £9,000 fees (with enrollment limits). This promotes equal access to health and education, breaking poverty cycles.
Pop Culture Tie: Minimum wage is a resilience boost, like a hero’s power-up; transfers, a shielding force field.
Practical Tip: Engage in discussions or petitions to refine policies, like adjusting inheritance tax thresholds. Test your knowledge with CAIE A2 Economics – Topic Questions.

UK Case Studies: Policies in Action and Their Impacts
These policies show varied results across the UK. From 2021-2023, the poorest quintile’s income fell 4% amid inflation, but the richest gained 2%; supports lifted the lowest third by 2.7%, slightly closing gaps. In Manchester, wage rises pulled 15% above poverty lines, reducing retail low-pay, though small businesses slowed hiring after the 2024 increase.
London exemplifies extremes: a 90:10 income ratio of 9.3 in 2022/23, with the top 10% at 32.3%. Inheritances boost South East medians to £350,000+ versus £150,000 in the North. Universal Credit averted 500,000 poverty cases in 2023, despite average £1,222 debts from transitions. NHS savings of £2,000 mitigate health disparities; Scotland’s tuition policy enhances mobility amid constraints. Housing and bequests persist as challenges—bottom 50% hold under 5% wealth—but incremental progress narrows divides.
Practical Tip: Use Office for National Statistics (ONS) tools to analyze local Gini and propose solutions for your region.

Frequently Asked Questions on UK Income and Wealth Inequality
- What’s the difference between income flow and wealth stock in inequality? Income flows are ongoing earnings, feeling immediate impacts like job loss; wealth stocks are accumulated assets, eroding gradually. Recent UK inflation targeted flows more acutely.
- How does the Gini coefficient work? From 0 (equal) to 1 (unequal), UK’s 2024 income at 32.9% indicates moderate inequality; wealth at 74.6% shows severe hoarding (ONS, 2024).
- Why is inheritance a major driver of wealth inequality? It transfers unearned assets, with the top 10% holding 57% via family wealth, leaving the bottom 50% with none (JRF, 2024).
- Is minimum wage effective against poverty? Yes, the 2024 rise aided millions, dropping poverty by 0.4%, with minimal job losses in areas like hospitality (IFS, 2024).
- Do progressive taxes reduce inequality? Absolutely, funding redistribution and narrowing UK income gaps by about 20% since the 1990s, though loopholes persist (Equality Trust, 2024).
- Are transfer payments mere welfare? No, they’re essential stabilizers—2023 Universal Credit kept 500,000 from poverty during cost spikes (DWP, 2024).
- How do NHS and free education combat inequality? They eliminate essential costs, saving low-income households £2,000+ yearly and improving access/mobility (IFS, 2024).
- Is UK inequality improving? Income holds steady with minor gains, but wealth worsens—bottom 50% under 5%, driven by housing and regions like the North (OECD, 2024).
Wrapping Up: Empowering Change Through Economic Knowledge
From distinguishing income flows and wealth stocks to decoding the Gini coefficient and dissecting causes, addressing income and wealth inequality demands ongoing government effort—achieving small income victories while battling entrenched wealth disparities. Equip yourself with these insights, visualize that Lorenz curve, and discuss policies with peers. This knowledge isn’t just academic; it’s key to advocating for a fairer UK. Ready for more? Explore our full CAIE AS Level Economics: The Price System and Microeconomy – Beginner’s Essential Guide.
References
- Equality Trust. (2024). Scale of Economic Inequality in the UK. https://equalitytrust.org.uk/scale-economic-inequality-uk/
- IFS. (2024). Living Standards, Poverty and Inequality in the UK. https://ifs.org.uk/publications/living-standards-poverty-and-inequality-uk-2024
- JRF. (2024). Changing the Narrative on Wealth Inequality. https://www.jrf.org.uk/narrative-change/changing-the-narrative-on-wealth-inequality
- ONS. (2024). Household Income Inequality, FYE 2024. https://www.ons.gov.uk/peoplepopulationandcommunity/personalandhouseholdfinances/incomeandwealth/bulletins/householdincomeinequalityfinancial/financialyearending2024
- OECD. (2024). Various reports on inequality. https://www.oecd.org/
- DWP. (2024). Households Below Average Income. https://www.gov.uk/government/statistics/households-below-average-income-for-financial-years-ending-1995-to-2024
- Low Pay Commission. (2024). National Minimum Wage Report. https://www.gov.uk/government/publications/low-pay-commission-national-minimum-wage-report-2024
- LSE CASE. (2024). Minimum Wages and Poverty. https://sticerd.lse.ac.uk/case/